- Page 2:
Principles of Plant Genetics and Br
- Page 6:
Principles of Plant Genetics and Br
- Page 10:
Industry highlights boxes, vii Indu
- Page 14:
Industry highlights boxes Chapter 1
- Page 18:
Industry highlights box authors Acq
- Page 22:
Plant breeding is an art and a scie
- Page 26:
The author expresses sincere gratit
- Page 32:
Section 1 Historical perspectives a
- Page 36:
4 CHAPTER 1 accomplish astonishing
- Page 40:
6 CHAPTER 1 modifying the crop prod
- Page 44:
8 CHAPTER 1 Table 1.2 Selected mile
- Page 48:
10 CHAPTER 1 one season. Furthermor
- Page 52:
12 CHAPTER 1 Figure 1 Dr Norman Bor
- Page 56:
14 CHAPTER 1 agrochemicals. Recent
- Page 60:
Section 2 General biological concep
- Page 64:
18 CHAPTER 2 discovered. As will be
- Page 68:
20 CHAPTER 2 antiquity is establish
- Page 72:
22 CHAPTER 2 cultivation in areas a
- Page 76:
24 CHAPTER 2 Table 2.1 Characterist
- Page 80:
26 CHAPTER 2 Table 2.2 An operation
- Page 84:
28 CHAPTER 2 elite germplasm or adv
- Page 88:
30 CHAPTER 2 identify the most prom
- Page 92:
32 CHAPTER 2 Research Institute (SC
- Page 96:
34 CHAPTER 2 Part A Please answer t
- Page 100:
36 CHAPTER 3 out that when plants a
- Page 104:
38 CHAPTER 3 Table 3.2 Number of ch
- Page 108:
40 CHAPTER 3 AA × aa (a) A × a Aa
- Page 112:
42 CHAPTER 3 (a) PP × pp Pp 100% (
- Page 116:
44 CHAPTER 3 AB Ab aB ab (a) Parent
- Page 120:
46 CHAPTER 3 lifeblood of plant bre
- Page 124:
48 CHAPTER 3 -A=T- 5′ 3′ 5′ 5
- Page 128:
50 CHAPTER 3 Expression of genetic
- Page 132:
52 CHAPTER 3 Enhancer region subuni
- Page 136:
54 CHAPTER 3 Part A Please answer t
- Page 140:
56 CHAPTER 4 may be capable of self
- Page 144:
58 CHAPTER 4 Death Seed Reproductiv
- Page 148:
60 CHAPTER 4 Table 4.1 Pollination
- Page 152:
62 CHAPTER 4 homozygous and therefo
- Page 156:
64 CHAPTER 4 price of hybrid seed.
- Page 160:
66 CHAPTER 4 (a) (b) Figure 1 (a) A
- Page 164:
68 CHAPTER 4 only the desired polle
- Page 168:
70 CHAPTER 4 used to make a self-in
- Page 172:
72 CHAPTER 4 Male-fertile RfRf or R
- Page 176:
Section 3 Germplasm issues Chapter
- Page 180:
76 CHAPTER 5 Kingdom Division Class
- Page 184:
78 CHAPTER 5 may be classified into
- Page 188:
80 CHAPTER 5 plant breeding. As pre
- Page 192:
82 CHAPTER 5 both DNA strands; and
- Page 196:
84 CHAPTER 5 100% 50% (a) 100% 50%
- Page 200:
86 CHAPTER 5 Part B Please answer t
- Page 204:
88 CHAPTER 6 programs is the steady
- Page 208:
90 CHAPTER 6 What is genetic vulner
- Page 212:
92 CHAPTER 6 Table 1 Conservation m
- Page 216:
94 CHAPTER 6 Table 3 Varieties regi
- Page 220:
96 CHAPTER 6 linkage maps and a new
- Page 224:
98 CHAPTER 6 Approaches to germplas
- Page 228:
100 CHAPTER 6 resources. Curators o
- Page 232:
102 CHAPTER 6 difficult for users t
- Page 236:
104 CHAPTER 6 and Agricultural Orga
- Page 240:
106 CHAPTER 6 Table 6.2 Germplasm h
- Page 244:
Section 4 Genetic analysis in plant
- Page 248:
110 CHAPTER 7 underlying genetic co
- Page 252:
112 CHAPTER 7 of genes as 1 : n : n
- Page 256:
114 CHAPTER 7 may be toxic in addit
- Page 260:
116 CHAPTER 7 any male gamete of th
- Page 264:
118 CHAPTER 7 B C D E A B C E A I I
- Page 268:
120 CHAPTER 7 heterozygous plants g
- Page 272:
122 CHAPTER 8 2 Absence of linkage.
- Page 276:
124 CHAPTER 8 Table 8.2 As the numb
- Page 280:
126 CHAPTER 8 pollen from a random
- Page 284:
128 CHAPTER 8 environmental varianc
- Page 288:
130 CHAPTER 8 This estimate is fair
- Page 292:
132 CHAPTER 8 in a decline in both
- Page 296:
134 CHAPTER 8 Tandem selection In t
- Page 300:
136 CHAPTER 8 day. This process was
- Page 304:
138 CHAPTER 8 Frequency (%) 40 30 2
- Page 308:
140 CHAPTER 8 ability, the procedur
- Page 312:
142 CHAPTER 8 family are evaluated,
- Page 316:
144 CHAPTER 8 A × B A F2 B F2 A F2
- Page 320:
Purpose and expected outcomes Stati
- Page 324:
148 CHAPTER 9 Concept of statistica
- Page 328:
150 CHAPTER 9 Using data in Table 9
- Page 332:
152 CHAPTER 9 Covariance =−2.45 C
- Page 336:
154 CHAPTER 9 were drawn follow the
- Page 340:
156 CHAPTER 9 Table 1 Summary of th
- Page 344:
158 CHAPTER 9 PC2 1.2 0.8 0.4 0.0 -
- Page 348:
160 CHAPTER 9 Label CASE 0 5 10 15
- Page 352:
162 CHAPTER 9 Part A Please answer
- Page 356:
Purpose and expected outcomes One o
- Page 360:
166 CHAPTER 10 developed. This is e
- Page 364:
168 CHAPTER 10 Application of polle
- Page 368:
170 CHAPTER 10 genes are so tightly
- Page 372:
172 CHAPTER 10 The purpose of these
- Page 376:
174 CHAPTER 10 Richard Novy Industr
- Page 380:
176 CHAPTER 10 Tubers of BC 2 gener
- Page 384:
178 CHAPTER 10 promote rapid pollen
- Page 388:
180 CHAPTER 10 3 Give three specifi
- Page 392:
182 CHAPTER 11 Overview of the tiss
- Page 396:
184 CHAPTER 11 organogenesis occurs
- Page 400:
186 CHAPTER 11 Products of somatic
- Page 404:
188 CHAPTER 11 Procedure using natu
- Page 408:
190 CHAPTER 11 Generation of haploi
- Page 412:
192 CHAPTER 11 Table 1 Estimated ga
- Page 416:
194 CHAPTER 11 the natural reproduc
- Page 420:
196 CHAPTER 11 clones with other su
- Page 424:
198 CHAPTER 11 Part A Please answer
- Page 428:
200 CHAPTER 12 genetic alteration (
- Page 432:
202 CHAPTER 12 G C (a) G Bu G C Fig
- Page 436:
204 CHAPTER 12 Table 12.2 Examples
- Page 440:
206 CHAPTER 12 cytological effects
- Page 444:
208 CHAPTER 12 Fruit quality and di
- Page 448:
210 CHAPTER 12 Table 1 Main descrip
- Page 452:
212 CHAPTER 12 undesirable side eff
- Page 456:
Purpose and expected outcomes Hybri
- Page 460:
216 CHAPTER 13 Table 13.3 Naming of
- Page 464:
218 CHAPTER 13 1 2 3 (a) (b) Figure
- Page 468:
220 CHAPTER 13 F (coefficient of in
- Page 472:
222 CHAPTER 13 the chromosomes of o
- Page 476:
224 CHAPTER 13 Microcloning of tall
- Page 480:
226 CHAPTER 13 Bread wheat (Triticu
- Page 484:
228 CHAPTER 13 1st meiotic division
- Page 488:
230 CHAPTER 13 Part A Please answer
- Page 492:
232 CHAPTER 14 called a transgenic
- Page 496:
234 CHAPTER 14 Gene identification
- Page 500:
236 CHAPTER 14 the non-destructive,
- Page 504:
238 CHAPTER 14 rDNA is that DNA is
- Page 508:
240 CHAPTER 14 Introduction Bioinfo
- Page 512:
242 CHAPTER 14 position or combinat
- Page 516:
244 CHAPTER 14 Steps in a DNA micro
- Page 520:
246 CHAPTER 14 sequence, and RIP co
- Page 524:
248 CHAPTER 14 Isozymes Enzymes are
- Page 528:
250 CHAPTER 14 genetic mapping. As
- Page 532:
252 CHAPTER 14 selection in a breed
- Page 536:
254 CHAPTER 14 guidelines. There ha
- Page 540:
256 CHAPTER 14 Part B Please answer
- Page 544:
258 CHAPTER 15 may not be patented
- Page 548:
260 CHAPTER 15 (e.g., USA) allow a
- Page 552:
262 CHAPTER 15 technology (e.g., th
- Page 556:
264 CHAPTER 15 information to be av
- Page 560:
266 CHAPTER 15 Service (USDA-APHIS)
- Page 564:
268 CHAPTER 15 that the agencies ty
- Page 568:
270 CHAPTER 15 Inspection Service (
- Page 572:
272 CHAPTER 15 Concept of substanti
- Page 576:
274 CHAPTER 15 One factor in boosti
- Page 580:
276 CHAPTER 15 Public perceptions a
- Page 584:
278 CHAPTER 15 2 The transfer of pr
- Page 588:
280 CHAPTER 15 Part B Please answer
- Page 592:
Purpose and expected outcomes As pr
- Page 596:
284 CHAPTER 16 Self-pollinated spec
- Page 600:
286 CHAPTER 16 Pedigree 2: MK2-57*3
- Page 604:
288 CHAPTER 16 3 The cultivar is ph
- Page 608:
290 CHAPTER 16 yields over a wider
- Page 612:
292 CHAPTER 16 Generation Year 1 P
- Page 616:
294 CHAPTER 16 2 The details of rec
- Page 620:
296 CHAPTER 16 1 At advanced genera
- Page 624:
298 CHAPTER 16 grains as well as le
- Page 628:
300 CHAPTER 16 Frequency P3 P2 P1 P
- Page 632:
302 CHAPTER 16 total production exc
- Page 636:
304 CHAPTER 16 Backcross breeding T
- Page 640:
306 CHAPTER 16 Year 1 Generation Ac
- Page 644:
308 CHAPTER 16 Disadvantages 1 Back
- Page 648:
310 CHAPTER 16 Two basic mechanisms
- Page 652:
312 CHAPTER 16 Part A Please answer
- Page 656:
314 CHAPTER 17 specific purposes. I
- Page 660:
316 CHAPTER 17 Key features The sel
- Page 664:
318 CHAPTER 17 replicated trials in
- Page 668:
320 CHAPTER 17 selected plants are
- Page 672:
322 CHAPTER 17 Repeat cycle Repeat
- Page 676:
324 CHAPTER 17 Experimental results
- Page 680:
326 CHAPTER 17 could be an effectiv
- Page 684:
328 CHAPTER 17 this section is that
- Page 688:
330 CHAPTER 17 Genetic issues The h
- Page 692:
332 CHAPTER 17 Agrawal, R.L. 1998.
- Page 696:
Purpose and expected outcomes The m
- Page 700:
336 CHAPTER 18 Introduction Jerry H
- Page 704:
338 CHAPTER 18 Most modern hybrids
- Page 708:
340 CHAPTER 18 Dominance theory The
- Page 712:
342 CHAPTER 18 Definition A heterot
- Page 716:
344 CHAPTER 18 storage or in nurser
- Page 720:
346 CHAPTER 18 Storage of seed It i
- Page 724:
348 CHAPTER 18 Further, it is good
- Page 728:
350 CHAPTER 18 Part A Please answer
- Page 732:
Purpose and expected outcomes Physi
- Page 736:
354 CHAPTER 19 accumulation. Of cou
- Page 740:
356 CHAPTER 19 conditions on the ha
- Page 744:
358 CHAPTER 19 Product concept Unde
- Page 748:
360 CHAPTER 19 % injury/chlorosis (
- Page 752:
362 CHAPTER 19 kind of adaptation h
- Page 756:
364 CHAPTER 19 to four-dwarfs. It i
- Page 760:
366 CHAPTER 19 Frey, K.J. 1959. Yie
- Page 764:
368 CHAPTER 20 Weed control is a ma
- Page 768:
370 CHAPTER 20 conditioned by allel
- Page 772:
372 CHAPTER 20 Genetics of host-pat
- Page 776:
374 CHAPTER 20 equivalent term appl
- Page 780:
376 CHAPTER 20 especially disease r
- Page 784:
378 CHAPTER 20 Introduction Nigel J
- Page 788:
380 CHAPTER 20 Initial proof of con
- Page 792:
382 CHAPTER 20 Bt cotton is another
- Page 796:
384 CHAPTER 20 (Hayward, M.D., N.O.
- Page 800:
386 CHAPTER 21 technologies are not
- Page 804:
388 CHAPTER 21 duration of drought
- Page 808:
390 CHAPTER 21 performance under, d
- Page 812:
392 CHAPTER 21 be the desert, where
- Page 816:
394 CHAPTER 21 type of sorghum that
- Page 820: 396 CHAPTER 21 determining and asse
- Page 824: 398 CHAPTER 21 ice-nucleating prote
- Page 828: 400 CHAPTER 21 Table 21.2 Examples
- Page 832: 402 CHAPTER 21 Table 21.4 Common de
- Page 836: Purpose and expected outcomes The m
- Page 840: 406 CHAPTER 22 1964 when researcher
- Page 844: 408 CHAPTER 22 Subsequent studies i
- Page 848: 410 CHAPTER 22 The making of “Gol
- Page 852: 412 CHAPTER 22 have been developed
- Page 856: 414 CHAPTER 22 Select diploid line
- Page 860: 416 CHAPTER 22 Part A Please answer
- Page 864: Purpose and expected outcomes The u
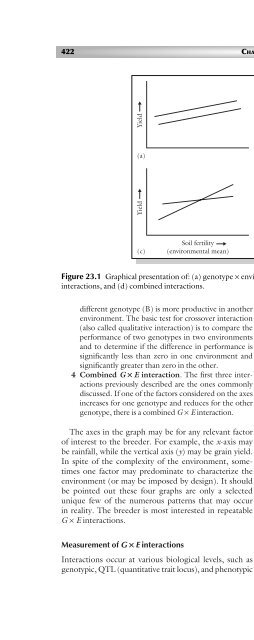
- Page 868: 420 CHAPTER 23 variety of data in a
- Page 874: Different models of ANOVA are used
- Page 878: Table 23.2 Stability analysis. PERF
- Page 882: PERFORMANCE EVALUATION FOR CROP CUL
- Page 886: esources available (land, seed, lab
- Page 890: Advantages 1 It is the simplest of
- Page 894: Mapping populations have additional
- Page 898: Purpose and expected outcomes The u
- Page 902: Funk Columbiana Farm Seed Germain
- Page 906: Joe W. Burton SEED CERTIFICATION AN
- Page 910: Registered seed Registered seed is
- Page 914: Canada’s Plant Breeders’ Rights
- Page 918: Seed certification process There ar
- Page 922:
Table 24.1 Information on a seed ta
- Page 926:
Boswell, V.R. 1961. The importance
- Page 930:
property is a major one in plant br
- Page 934:
important issues to be considered i
- Page 938:
Soybean Soybean research is conduct
- Page 942:
INTERNATIONAL PLANT BREEDING EFFORT
- Page 946:
Selected accomplishments The impact
- Page 950:
national entities. More importantly
- Page 954:
Cicarelli contest that most farmers
- Page 958:
EMERGING CONCEPTS IN PLANT BREEDING
- Page 962:
EMERGING CONCEPTS IN PLANT BREEDING
- Page 966:
Principles of organic plant breedin
- Page 970:
Part II Breeding selected crops Cha
- Page 974:
Adaptation Wheat is best adapted to
- Page 978:
are less successful, being of poor
- Page 982:
Introduction BREEDING WHEAT 477 Ind
- Page 986:
Host plant resistance to disease an
- Page 990:
Greenhouse nursery Breeders may use
- Page 994:
when the production area is isolate
- Page 998:
Taxonomy Kingdom Plantae Subkingdom
- Page 1002:
encloses the soft starch at the cen
- Page 1006:
Designated ms 1 , ms 2 ,...ms n , o
- Page 1010:
F. J. Betrán Texas A&M University,
- Page 1014:
Development of hybrids BREEDING COR
- Page 1018:
chambers may be used for experiment
- Page 1022:
orer. A chemical found in corn with
- Page 1026:
A British sea captain brought rice
- Page 1030:
while awnless is conditioned by an
- Page 1034:
Figure 1 Rice panicle being prepare
- Page 1038:
Figure 5 A foundation seed field of
- Page 1042:
emoved with forceps, the cut may be
- Page 1046:
Taxonomy Kingdom Plantae Subkingdom
- Page 1050:
green midrib because of the presenc
- Page 1054:
BREEDING SORGHUM 513 Kansas State U
- Page 1058:
Summer Year 5 Summer Year 7 Summer
- Page 1062:
covered with the bag. Pollination s
- Page 1066:
Taxonomy Kingdom Plantae Subkingdom
- Page 1070:
and brown being dominant over gray.
- Page 1074:
BREEDING SOYBEAN 523 easily selecte
- Page 1078:
BREEDING SOYBEAN 525 An advantage o
- Page 1082:
Common breeding objectives 1 Grain
- Page 1086:
Taxonomy Kingdom Plantae Subkingdom
- Page 1090:
Program objectives Charles Simpson
- Page 1094:
BREEDING PEANUT 533 lines in hopes
- Page 1098:
for emasculation, which is done in
- Page 1102:
Taxonomy Kingdom Plantae Subkingdom
- Page 1106:
Evolution of the modern potato crop
- Page 1110:
BREEDING POTATO 541 Table 1 The Sco
- Page 1114:
(berries) called potato balls. The
- Page 1118:
6 Potato tuber quality improvement.
- Page 1122:
grown in America, Africa, Asia, and
- Page 1126:
Introduction Don L. Keim BREEDING C
- Page 1130:
BREEDING COTTON 551 are grown in tr
- Page 1134:
economically important traits has b
- Page 1138:
Part B Please answer the following
- Page 1142:
Central dogma: The underlying model
- Page 1146:
Mitosis: The process of nuclear div
- Page 1150:
Chapter 1 http://www.foodfirst.org/
- Page 1154:
Imperial unit Metric conversion Vol
- Page 1158:
complex inheritance, 42 composite c
- Page 1162:
minor gene resistance, 371 minor ge
- Page 1166:
technology protection system (TPS),