Pan-Pacific Conference XXXIV. Designing New Business Models in Developing Economies
This publication represents the Proceedings of the 34th Annual Pan-Pacific Conference being held in Lima, Peru May 29-31, 2017. The Pan-Pacific Conference has served as an important forum for the exchange of ideas and information for promoting understanding and cooperation among the peoples of the world since 1984. Last year, we had a memorable conference in Miri, Malaysia, in cooperation with Curtin University Sarawak, under the theme of “Building a Smart Society through Innovation and Co-creation.” Professor Pauline Ho served as Chair of the Local Organizing Committee, with strong leadership support of Pro Vice-Chancellor Professor Jim Mienczakowski and Dean Jonathan Winterton.
This publication represents the Proceedings of the 34th Annual Pan-Pacific Conference being held in Lima, Peru May 29-31, 2017. The Pan-Pacific Conference has served as an important forum for the exchange of ideas and information for promoting understanding and cooperation among the peoples of the world since 1984. Last year, we had a memorable conference in Miri, Malaysia, in cooperation with Curtin University Sarawak, under the theme of “Building a Smart Society through Innovation and Co-creation.” Professor Pauline Ho served as Chair of the Local Organizing Committee, with strong leadership support of Pro Vice-Chancellor Professor Jim Mienczakowski and Dean Jonathan Winterton.

Create successful ePaper yourself
Turn your PDF publications into a flip-book with our unique Google optimized e-Paper software.
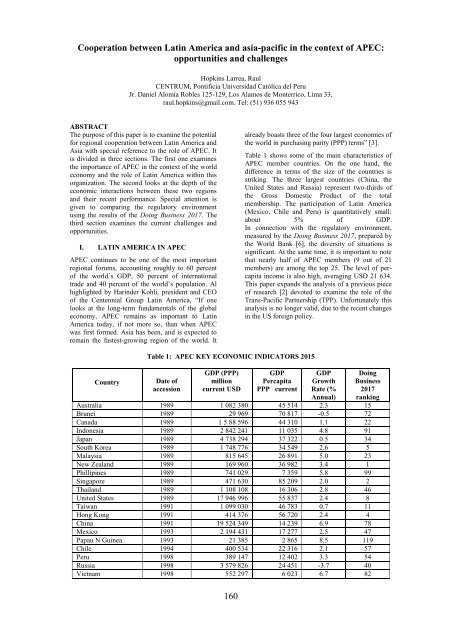
Cooperation between Lat<strong>in</strong> America and asia-pacific <strong>in</strong> the context of APEC:<br />
opportunities and challenges<br />
Hopk<strong>in</strong>s Larrea, Raul<br />
CENTRUM, Pontificia Universidad Católica del Peru<br />
Jr. Daniel Alomía Robles 125-129, Los Alamos de Monterrico, Lima 33,<br />
raul.hopk<strong>in</strong>s@gmail.com. Tel: (51) 936 055 943<br />
ABSTRACT<br />
The purpose of this paper is to exam<strong>in</strong>e the potential<br />
for regional cooperation between Lat<strong>in</strong> America and<br />
Asia with special reference to the role of APEC. It<br />
is divided <strong>in</strong> three sections. The first one exam<strong>in</strong>es<br />
the importance of APEC <strong>in</strong> the context of the world<br />
economy and the role of Lat<strong>in</strong> America with<strong>in</strong> this<br />
organization. The second looks at the depth of the<br />
economic <strong>in</strong>teractions between these two regions<br />
and their recent performance. Special attention is<br />
given to compar<strong>in</strong>g the regulatory environment<br />
us<strong>in</strong>g the results of the Do<strong>in</strong>g <strong>Bus<strong>in</strong>ess</strong> 2017. The<br />
third section exam<strong>in</strong>es the current challenges and<br />
opportunities.<br />
I. LATIN AMERICA IN APEC<br />
APEC cont<strong>in</strong>ues to be one of the most important<br />
regional forums, account<strong>in</strong>g roughly to 60 percent<br />
of the world´s GDP, 50 percent of <strong>in</strong>ternational<br />
trade and 40 percent of the world’s population. Al<br />
highlighted by Har<strong>in</strong>der Kohli, president and CEO<br />
of the Centennial Group Lat<strong>in</strong> America, “If one<br />
looks at the long-term fundamentals of the global<br />
economy, APEC rema<strong>in</strong>s as important to Lat<strong>in</strong><br />
America today, if not more so, than when APEC<br />
was first formed. Asia has been, and is expected to<br />
rema<strong>in</strong> the fastest-grow<strong>in</strong>g region of the world. It<br />
already boasts three of the four largest economies of<br />
the world <strong>in</strong> purchas<strong>in</strong>g parity (PPP) terms” [3].<br />
Table 1 shows some of the ma<strong>in</strong> characteristics of<br />
APEC member countries. On the one hand, the<br />
difference <strong>in</strong> terms of the size of the countries is<br />
strik<strong>in</strong>g. The three largest countries (Ch<strong>in</strong>a, the<br />
United States and Russia) represent two-thirds of<br />
the Gross Domestic Product of the total<br />
membership. The participation of Lat<strong>in</strong> America<br />
(Mexico, Chile and Peru) is quantitatively small:<br />
about 5% of GDP.<br />
In connection with the regulatory environment,<br />
measured by the Do<strong>in</strong>g <strong>Bus<strong>in</strong>ess</strong> 2017, prepared by<br />
the World Bank [6], the diversity of situations is<br />
significant. At the same time, it is important to note<br />
that nearly half of APEC members (9 out of 21<br />
members) are among the top 25. The level of percapita<br />
<strong>in</strong>come is also high, averag<strong>in</strong>g USD 21 634.<br />
This paper expands the analysis of a previous piece<br />
of research [2] devoted to exam<strong>in</strong>e the role of the<br />
Trans-<strong>Pacific</strong> Partnership (TPP). Unfortunately this<br />
analysis is no longer valid, due to the recent changes<br />
<strong>in</strong> the US foreign policy.<br />
Country<br />
Table 1: APEC KEY ECONOMIC INDICATORS 2015<br />
Date of<br />
accession<br />
GDP (PPP)<br />
million<br />
current USD<br />
160<br />
GDP<br />
Percapita<br />
PPP current<br />
GDP<br />
Growth<br />
Rate (%<br />
Annual)<br />
Do<strong>in</strong>g<br />
<strong>Bus<strong>in</strong>ess</strong><br />
2017<br />
rank<strong>in</strong>g<br />
Australia 1989 1 082 380 45 514 2.3 15<br />
Brunei 1989 29 969 70 817 -0.5 72<br />
Canada 1989 1 5 88 596 44 310 1.1 22<br />
Indonesia 1989 2 842 241 11 035 4.8 91<br />
Japan 1989 4 738 294 37 322 0.5 34<br />
South Korea 1989 1 748 776 34 549 2.6 5<br />
Malaysia 1989 815 645 26 891 5.0 23<br />
<strong>New</strong> Zealand 1989 169 960 36 982 3.4 1<br />
Phillip<strong>in</strong>es 1989 741 029 7 359 5.8 99<br />
S<strong>in</strong>gapore 1989 471 630 85 209 2.0 2<br />
Thailand 1989 1 108 108 16 306 2.8 46<br />
United States 1989 17 946 996 55 837 2.4 8<br />
Taiwan 1991 1 099 030 46 783 0.7 11<br />
Hong Kong 1991 414 376 56 720 2.4 4<br />
Ch<strong>in</strong>a 1991 19 524 349 14 239 6.9 78<br />
Mexico 1993 2 194 431 17 277 2.5 47<br />
Papau N Gu<strong>in</strong>ea 1993 21 385 2 865 8.5 119<br />
Chile 1994 400 534 22 316 2.1 57<br />
Peru 1998 389 147 12 402 3.3 54<br />
Russia 1998 3 579 826 24 451 -3.7 40<br />
Vietnam 1998 552 297 6 023 6.7 82