Pan-Pacific Conference XXXIV. Designing New Business Models in Developing Economies
This publication represents the Proceedings of the 34th Annual Pan-Pacific Conference being held in Lima, Peru May 29-31, 2017. The Pan-Pacific Conference has served as an important forum for the exchange of ideas and information for promoting understanding and cooperation among the peoples of the world since 1984. Last year, we had a memorable conference in Miri, Malaysia, in cooperation with Curtin University Sarawak, under the theme of “Building a Smart Society through Innovation and Co-creation.” Professor Pauline Ho served as Chair of the Local Organizing Committee, with strong leadership support of Pro Vice-Chancellor Professor Jim Mienczakowski and Dean Jonathan Winterton.
This publication represents the Proceedings of the 34th Annual Pan-Pacific Conference being held in Lima, Peru May 29-31, 2017. The Pan-Pacific Conference has served as an important forum for the exchange of ideas and information for promoting understanding and cooperation among the peoples of the world since 1984. Last year, we had a memorable conference in Miri, Malaysia, in cooperation with Curtin University Sarawak, under the theme of “Building a Smart Society through Innovation and Co-creation.” Professor Pauline Ho served as Chair of the Local Organizing Committee, with strong leadership support of Pro Vice-Chancellor Professor Jim Mienczakowski and Dean Jonathan Winterton.
You also want an ePaper? Increase the reach of your titles
YUMPU automatically turns print PDFs into web optimized ePapers that Google loves.
webpages, the Scopus database, WebofScience, Google<br />
Scholar, L<strong>in</strong>kedIn). For the purposes of our research,<br />
complete <strong>in</strong>formation from secondary data was available<br />
for 111 academics, result<strong>in</strong>g to a sample conta<strong>in</strong><strong>in</strong>g 30%<br />
of the total observations of the <strong>in</strong>itial population.<br />
We then created multiple <strong>in</strong>dexes, aim<strong>in</strong>g to capture the<br />
research productivity of academics and the research<br />
quality of their publications for each of the promotion<br />
periods described above. Throughout this process, the<br />
calculation of <strong>in</strong>dexes was based on the OM/OR<br />
journals’ rank<strong>in</strong>gs of the respective ABS Academic<br />
Journal Quality list valid <strong>in</strong> each case at the year of<br />
promotion (i.e. the list of 2007 was utilized for 2007<br />
promotion year and all years downwards- <strong>in</strong> the absence<br />
of former official lists; the list of 2008 for 2008; the list<br />
of 2009 for 2009; the list of 2010 for years 2010-2014;<br />
f<strong>in</strong>ally, the list of 2015 was utilized for 2015 onwards).<br />
Statistical analysis demonstrates how promotion<br />
requirements change across promotion periods. Most<br />
importantly, it highlights the evolution of promotion<br />
requirements over time, and reveals promotion trends<br />
with<strong>in</strong> the OM/OR discipl<strong>in</strong>e. Indicative descriptive<br />
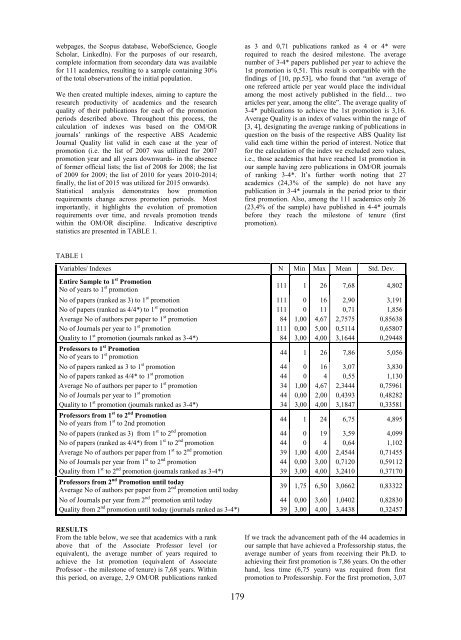
statistics are presented <strong>in</strong> TABLE 1.<br />
as 3 and 0,71 publications ranked as 4 or 4* were<br />
required to reach the desired milestone. The average<br />
number of 3-4* papers published per year to achieve the<br />
1st promotion is 0,51. This result is compatible with the<br />
f<strong>in</strong>d<strong>in</strong>gs of [10, pp.53], who found that “an average of<br />
one refereed article per year would place the <strong>in</strong>dividual<br />
among the most actively published <strong>in</strong> the field… two<br />
articles per year, among the elite”. The average quality of<br />
3-4* publications to achieve the 1st promotion is 3,16.<br />
Average Quality is an <strong>in</strong>dex of values with<strong>in</strong> the range of<br />
[3, 4], designat<strong>in</strong>g the average rank<strong>in</strong>g of publications <strong>in</strong><br />
question on the basis of the respective ABS Quality list<br />
valid each time with<strong>in</strong> the period of <strong>in</strong>terest. Notice that<br />
for the calculation of the <strong>in</strong>dex we excluded zero values,<br />
i.e., those academics that have reached 1st promotion <strong>in</strong><br />
our sample hav<strong>in</strong>g zero publications <strong>in</strong> OM/OR journals<br />
of rank<strong>in</strong>g 3-4*. It’s further worth not<strong>in</strong>g that 27<br />
academics (24,3% of the sample) do not have any<br />
publication <strong>in</strong> 3-4* journals <strong>in</strong> the period prior to their<br />
first promotion. Also, among the 111 academics only 26<br />
(23,4% of the sample) have published <strong>in</strong> 4-4* journals<br />
before they reach the milestone of tenure (first<br />
promotion).<br />
TABLE 1<br />
Variables/ Indexes N M<strong>in</strong> Max Mean Std. Dev.<br />
Entire Sample to 1 st Promotion<br />
No of years to 1 st promotion<br />
111 1 26 7,68 4,802<br />
No of papers (ranked as 3) to 1 st promotion 111 0 16 2,90 3,191<br />
No of papers (ranked as 4/4*) to 1 st promotion 111 0 11 0,71 1,856<br />
Average No of authors per paper to 1 st promotion 84 1,00 4,67 2,7575 0,85638<br />
No of Journals per year to 1 st promotion 111 0,00 5,00 0,5114 0,65807<br />
Quality to 1 st promotion (journals ranked as 3-4*) 84 3,00 4,00 3,1644 0,29448<br />
Professors to 1 st Promotion<br />
No of years to 1 st promotion<br />
44 1 26 7,86 5,056<br />
No of papers ranked as 3 to 1 st promotion 44 0 16 3,07 3,830<br />
No of papers ranked as 4/4* to 1 st promotion 44 0 4 0,55 1,130<br />
Average No of authors per paper to 1 st promotion 34 1,00 4,67 2,3444 0,75961<br />
No of Journals per year to 1 st promotion 44 0,00 2,00 0,4393 0,48282<br />
Quality to 1 st promotion (journals ranked as 3-4*) 34 3,00 4,00 3,1847 0,33581<br />
Professors from 1 st to 2 nd Promotion<br />
No of years from 1 st to 2nd promotion<br />
44 1 24 6,75 4,895<br />
No of papers (ranked as 3) from 1 st to 2 nd promotion 44 0 19 3,59 4,099<br />
No of papers (ranked as 4/4*) from 1 st to 2 nd promotion 44 0 4 0,64 1,102<br />
Average No of authors per paper from 1 st to 2 nd promotion 39 1,00 4,00 2,4544 0,71455<br />
No of Journals per year from 1 st to 2 nd promotion 44 0,00 3,00 0,7120 0,59112<br />
Quality from 1 st to 2 nd promotion (journals ranked as 3-4*) 39 3,00 4,00 3,2410 0,37170<br />
Professors from 2 nd Promotion until today<br />
Average No of authors per paper from 2 nd promotion until today<br />
39 1,75 6,50 3,0662 0,83322<br />
No of Journals per year from 2 nd promotion until today 44 0,00 3,60 1,0402 0,82830<br />
Quality from 2 nd promotion until today (journals ranked as 3-4*) 39 3,00 4,00 3,4438 0,32457<br />
RESULTS<br />
From the table below, we see that academics with a rank<br />
above that of the Associate Professor level (or<br />
equivalent), the average number of years required to<br />
achieve the 1st promotion (equivalent of Associate<br />
Professor - the milestone of tenure) is 7,68 years. With<strong>in</strong><br />
this period, on average, 2,9 OM/OR publications ranked<br />
If we track the advancement path of the 44 academics <strong>in</strong><br />
our sample that have achieved a Professorship status, the<br />
average number of years from receiv<strong>in</strong>g their Ph.D. to<br />
achiev<strong>in</strong>g their first promotion is 7,86 years. On the other<br />
hand, less time (6,75 years) was required from first<br />
promotion to Professorship. For the first promotion, 3,07<br />
179


