Pan-Pacific Conference XXXIV. Designing New Business Models in Developing Economies
This publication represents the Proceedings of the 34th Annual Pan-Pacific Conference being held in Lima, Peru May 29-31, 2017. The Pan-Pacific Conference has served as an important forum for the exchange of ideas and information for promoting understanding and cooperation among the peoples of the world since 1984. Last year, we had a memorable conference in Miri, Malaysia, in cooperation with Curtin University Sarawak, under the theme of “Building a Smart Society through Innovation and Co-creation.” Professor Pauline Ho served as Chair of the Local Organizing Committee, with strong leadership support of Pro Vice-Chancellor Professor Jim Mienczakowski and Dean Jonathan Winterton.
This publication represents the Proceedings of the 34th Annual Pan-Pacific Conference being held in Lima, Peru May 29-31, 2017. The Pan-Pacific Conference has served as an important forum for the exchange of ideas and information for promoting understanding and cooperation among the peoples of the world since 1984. Last year, we had a memorable conference in Miri, Malaysia, in cooperation with Curtin University Sarawak, under the theme of “Building a Smart Society through Innovation and Co-creation.” Professor Pauline Ho served as Chair of the Local Organizing Committee, with strong leadership support of Pro Vice-Chancellor Professor Jim Mienczakowski and Dean Jonathan Winterton.

You also want an ePaper? Increase the reach of your titles
YUMPU automatically turns print PDFs into web optimized ePapers that Google loves.
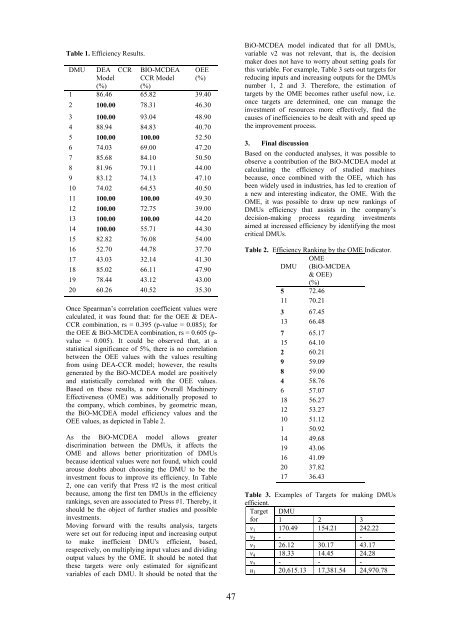
Table 1. Efficiency Results.<br />
DMU DEA CCR<br />
Model<br />
(%)<br />
BIO-MCDEA<br />
CCR Model<br />
(%)<br />
OEE<br />
(%)<br />
1 86.46 65.82 39.40<br />
2 100.00 78.31 46.30<br />
3 100.00 93.04 48.90<br />
4 88.94 84.83 40.70<br />
5 100.00 100.00 52.50<br />
6 74.03 69.00 47.20<br />
7 85.68 84.10 50.50<br />
8 81.96 79.11 44.00<br />
9 83.12 74.13 47.10<br />
10 74.02 64.53 40.50<br />
11 100.00 100.00 49.30<br />
12 100.00 72.75 39.00<br />
13 100.00 100.00 44.20<br />
14 100.00 55.71 44.30<br />
15 82.82 76.08 54.00<br />
16 52.70 44.78 37.70<br />
17 43.03 32.14 41.30<br />
18 85.02 66.11 47.90<br />
19 78.44 43.12 43.00<br />
20 60.26 40.52 35.30<br />
Once Spearman’s correlation coefficient values were<br />
calculated, it was found that: for the OEE & DEA-<br />
CCR comb<strong>in</strong>ation, rs = 0.395 (p-value = 0.085); for<br />
the OEE & BiO-MCDEA comb<strong>in</strong>ation, rs = 0.605 (pvalue<br />
= 0.005). It could be observed that, at a<br />
statistical significance of 5%, there is no correlation<br />
between the OEE values with the values result<strong>in</strong>g<br />
from us<strong>in</strong>g DEA-CCR model; however, the results<br />
generated by the BiO-MCDEA model are positively<br />
and statistically correlated with the OEE values.<br />
Based on these results, a new Overall Mach<strong>in</strong>ery<br />
Effectiveness (OME) was additionally proposed to<br />
the company, which comb<strong>in</strong>es, by geometric mean,<br />
the BiO-MCDEA model efficiency values and the<br />
OEE values, as depicted <strong>in</strong> Table 2.<br />
As the BiO-MCDEA model allows greater<br />
discrim<strong>in</strong>ation between the DMUs, it affects the<br />
OME and allows better prioritization of DMUs<br />
because identical values were not found, which could<br />
arouse doubts about choos<strong>in</strong>g the DMU to be the<br />
<strong>in</strong>vestment focus to improve its efficiency. In Table<br />
2, one can verify that Press #2 is the most critical<br />
because, among the first ten DMUs <strong>in</strong> the efficiency<br />
rank<strong>in</strong>gs, seven are associated to Press #1. Thereby, it<br />
should be the object of further studies and possible<br />
<strong>in</strong>vestments.<br />
Mov<strong>in</strong>g forward with the results analysis, targets<br />
were set out for reduc<strong>in</strong>g <strong>in</strong>put and <strong>in</strong>creas<strong>in</strong>g output<br />
to make <strong>in</strong>efficient DMU's efficient, based,<br />
respectively, on multiply<strong>in</strong>g <strong>in</strong>put values and divid<strong>in</strong>g<br />
output values by the OME. It should be noted that<br />
these targets were only estimated for significant<br />
variables of each DMU. It should be noted that the<br />
BiO-MCDEA model <strong>in</strong>dicated that for all DMUs,<br />
variable v2 was not relevant, that is, the decision<br />
maker does not have to worry about sett<strong>in</strong>g goals for<br />
this variable. For example, Table 3 sets out targets for<br />
reduc<strong>in</strong>g <strong>in</strong>puts and <strong>in</strong>creas<strong>in</strong>g outputs for the DMUs<br />
number 1, 2 and 3. Therefore, the estimation of<br />
targets by the OME becomes rather useful now, i.e.<br />
once targets are determ<strong>in</strong>ed, one can manage the<br />
<strong>in</strong>vestment of resources more effectively, f<strong>in</strong>d the<br />
causes of <strong>in</strong>efficiencies to be dealt with and speed up<br />
the improvement process.<br />
3. F<strong>in</strong>al discussion<br />
Based on the conducted analyses, it was possible to<br />
observe a contribution of the BiO-MCDEA model at<br />
calculat<strong>in</strong>g the efficiency of studied mach<strong>in</strong>es<br />
because, once comb<strong>in</strong>ed with the OEE, which has<br />
been widely used <strong>in</strong> <strong>in</strong>dustries, has led to creation of<br />
a new and <strong>in</strong>terest<strong>in</strong>g <strong>in</strong>dicator, the OME. With the<br />
OME, it was possible to draw up new rank<strong>in</strong>gs of<br />
DMUs efficiency that assists <strong>in</strong> the company’s<br />
decision-mak<strong>in</strong>g process regard<strong>in</strong>g <strong>in</strong>vestments<br />
aimed at <strong>in</strong>creased efficiency by identify<strong>in</strong>g the most<br />
critical DMUs.<br />
Table 2. Efficiency Rank<strong>in</strong>g by the OME Indicator.<br />
OME<br />
DMU (BiO-MCDEA<br />
& OEE)<br />
(%)<br />
5 72.46<br />
11 70.21<br />
3 67.45<br />
13 66.48<br />
7 65.17<br />
15 64.10<br />
2 60.21<br />
9 59.09<br />
8 59.00<br />
4 58.76<br />
6 57.07<br />
18 56.27<br />
12 53.27<br />
10 51.12<br />
1 50.92<br />
14 49.68<br />
19 43.06<br />
16 41.09<br />
20 37.82<br />
17 36.43<br />
Table 3. Examples of Targets for mak<strong>in</strong>g DMUs<br />
efficient.<br />
Target<br />
for<br />
DMU<br />
1 2 3<br />
v 1 170.49 154.21 242.22<br />
v 2 - -<br />
v 3 26.12 30.17 43.17<br />
v 4 18.33 14.45 24.28<br />
v 5 - - -<br />
u 1 20,615.13 17,381.54 24,970.78<br />
47