Pan-Pacific Conference XXXIV. Designing New Business Models in Developing Economies
This publication represents the Proceedings of the 34th Annual Pan-Pacific Conference being held in Lima, Peru May 29-31, 2017. The Pan-Pacific Conference has served as an important forum for the exchange of ideas and information for promoting understanding and cooperation among the peoples of the world since 1984. Last year, we had a memorable conference in Miri, Malaysia, in cooperation with Curtin University Sarawak, under the theme of “Building a Smart Society through Innovation and Co-creation.” Professor Pauline Ho served as Chair of the Local Organizing Committee, with strong leadership support of Pro Vice-Chancellor Professor Jim Mienczakowski and Dean Jonathan Winterton.
This publication represents the Proceedings of the 34th Annual Pan-Pacific Conference being held in Lima, Peru May 29-31, 2017. The Pan-Pacific Conference has served as an important forum for the exchange of ideas and information for promoting understanding and cooperation among the peoples of the world since 1984. Last year, we had a memorable conference in Miri, Malaysia, in cooperation with Curtin University Sarawak, under the theme of “Building a Smart Society through Innovation and Co-creation.” Professor Pauline Ho served as Chair of the Local Organizing Committee, with strong leadership support of Pro Vice-Chancellor Professor Jim Mienczakowski and Dean Jonathan Winterton.

You also want an ePaper? Increase the reach of your titles
YUMPU automatically turns print PDFs into web optimized ePapers that Google loves.
1 if St<br />
k ( k 1,2)<br />
Skt<br />
<br />
0 otherwise<br />
Pr(S<br />
t<br />
j | St<br />
1<br />
i) pij<br />
, i,<br />
j<br />
2<br />
<br />
j1<br />
p<br />
ij<br />
1<br />
<br />
2 2<br />
2 1<br />
=1,2<br />
Where y t is the quarterly growth rate <strong>in</strong> the output<br />
level, S t is an unobserved state variable that<br />
progresses based on first order Markov process with<br />
transition probabilities given <strong>in</strong> equation. The<br />
dynamic forces <strong>in</strong> long run are adm<strong>in</strong>istered through<br />
changes <strong>in</strong> unconditional variance of different<br />
regimes based on a first order Markov switch<strong>in</strong>g<br />
process. The variance of the growth rate <strong>in</strong> GDP<br />
may then be computed as,<br />
E(σ 2 t |(ŷ) T ) = (σ) ̂ E(S 12 t = 1|(ŷ) T )<br />
+ (σ) ̂ 22 E(S t |(ŷ) T )<br />
Where, (σ) ̂ 12 is the estimate of volatility <strong>in</strong> state<br />
̂ 22 is the estimate of volatility <strong>in</strong> state 2.<br />
1, (σ)<br />
DISCUSSION OF RESULTS<br />
The results of GARCH model estimation <strong>in</strong>dicate<br />
that the AR order of mean equation for Pakistan and<br />
Japan is one, while the order for USA is three. Both<br />
coefficients of ARCH (0.3285) and GARCH<br />
(0.7065) effect for Pakistan are statistically<br />
significant. Similarly, ARCH and GARCH terms<br />
are also significant for USA and Japan. Tak<strong>in</strong>g an<br />
overall view of GARCH coefficient <strong>in</strong> all four<br />
economies, observed relatively similar estimates<br />
and significant. Whereas, the ARCH term <strong>in</strong><br />
Pakistan is quite discrepant with a larger estimate<br />
likewise Japans’ GARCH term estimate is relatively<br />
smaller than other economies. Moreover, the sum of<br />
α1 and β1 <strong>in</strong>dicates persistence of volatility of<br />
0.9838 for USA and India respectively, versus<br />
almost 1.0 for Pakistan. Review<strong>in</strong>g the economy, is<br />
0.8574 for Japan, while 0.9732 analysis provided by<br />
[6] about non-l<strong>in</strong>ear time series, the existence of<br />
highest volatility <strong>in</strong> overall output growth level is <strong>in</strong><br />
Pakistan, USA and India <strong>in</strong> term of persistence of<br />
volatility is relatively high, but it is relatively low <strong>in</strong><br />
Japan.<br />
The results of Markov switch<strong>in</strong>g heteroscedasticity<br />
show (Table4) the propensity to rema<strong>in</strong> <strong>in</strong> the low<br />
variance state p22, as 0.9911 for Pakistan, 0.97489<br />
for USA, 0.9940 and 0.8751 for India and Japan<br />
respectively. Similarly, the probability p11 is<br />
estimated as 0.9960, 0.9634, 0.9780, and 0.9802 for<br />
Pakistan, USA, Indian, and Japan respectively.<br />
Mov<strong>in</strong>g towards the variance <strong>in</strong> low volatility state<br />
denoted by σ2, and is estimated at 4.554 for<br />
Pakistan, 1.654 for USA, 4.817 and 3.229 for India<br />
and Japan respectively. Likewise, the variance of<br />
high volatility state is 15.65 for Pakistan, 3.69 for<br />
USA, 8.185 and 6.878 for India and Japan<br />
respectively.<br />
Table 4: Real GDP growth rate: Markov<br />
Switch<strong>in</strong>g Heteroscedasticity Model<br />
estimation<br />
Pakistan US<br />
3.692348* A<br />
India<br />
8.18513<br />
15.651<br />
4*<br />
2<br />
σ<br />
9* (0.451562) (0.93273<br />
1<br />
(0.82542<br />
5)<br />
4) 1.654349* 4.816646<br />
2<br />
σ 2 (0.131418) (0.30515 *<br />
4.55434<br />
(0.54131 0.9634823 0.978002 2)<br />
P 11<br />
9* 1)<br />
(0.004 (0.045222) * (0.01977 1*<br />
0.99600<br />
467)<br />
39)<br />
P 22<br />
16*<br />
0. 0.974889* 0.993964<br />
(0.013 (0.019308) (0.00640 3*<br />
99<br />
019)<br />
1)<br />
11<br />
Japan<br />
6.877717*<br />
(1.43580)<br />
3.228977*<br />
(0.23889<br />
0.9802704 1)<br />
(0.01592 *<br />
0.8751064 05)<br />
(0.09447 *<br />
07)<br />
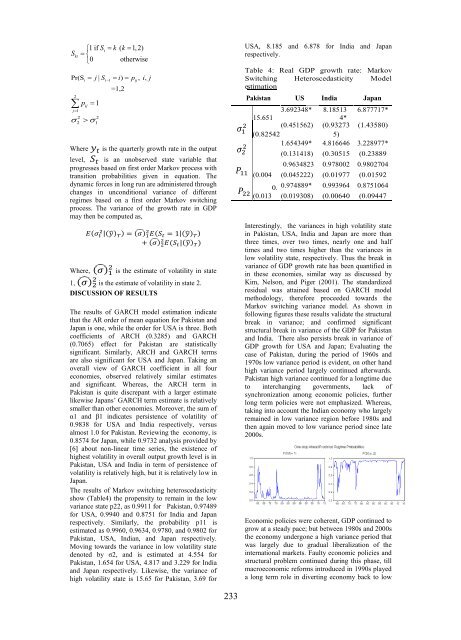
Interest<strong>in</strong>gly, 08 the variances <strong>in</strong> high volatility state<br />
<strong>in</strong> Pakistan, * USA, India and Japan are more than<br />
three times, over two times, nearly one and half<br />
times and two times higher than the variances <strong>in</strong><br />
low volatility state, respectively. Thus the break <strong>in</strong><br />
variance of GDP growth rate has been quantified <strong>in</strong><br />
<strong>in</strong> these economies, similar way as discussed by<br />
Kim, Nelson, and Piger (2001). The standardized<br />
residual was atta<strong>in</strong>ed based on GARCH model<br />
methodology, therefore proceeded towards the<br />
Markov switch<strong>in</strong>g variance model. As shown <strong>in</strong><br />
follow<strong>in</strong>g figures these results validate the structural<br />
break <strong>in</strong> variance; and confirmed significant<br />
structural break <strong>in</strong> variance of the GDP for Pakistan<br />
and India. There also persists break <strong>in</strong> variance of<br />
GDP growth for USA and Japan; Evaluat<strong>in</strong>g the<br />
case of Pakistan, dur<strong>in</strong>g the period of 1960s and<br />
1970s low variance period is evident, on other hand<br />
high variance period largely cont<strong>in</strong>ued afterwards.<br />
Pakistan high variance cont<strong>in</strong>ued for a longtime due<br />
to <strong>in</strong>terchang<strong>in</strong>g governments, lack of<br />
synchronization among economic policies, further<br />
long term policies were not emphasized. Whereas,<br />
tak<strong>in</strong>g <strong>in</strong>to account the Indian economy who largely<br />
rema<strong>in</strong>ed <strong>in</strong> low variance region before 1980s and<br />
then aga<strong>in</strong> moved to low variance period s<strong>in</strong>ce late<br />
2000s.<br />
Economic policies were coherent, GDP cont<strong>in</strong>ued to<br />
grow at a steady pace; but between 1980s and 2000s<br />
the economy undergone a high variance period that<br />
was largely due to gradual liberalization of the<br />
<strong>in</strong>ternational markets. Faulty economic policies and<br />
structural problem cont<strong>in</strong>ued dur<strong>in</strong>g this phase, till<br />
macroeconomic reforms <strong>in</strong>troduced <strong>in</strong> 1990s played<br />
a long term role <strong>in</strong> divert<strong>in</strong>g economy back to low<br />
233