Pan-Pacific Conference XXXIV. Designing New Business Models in Developing Economies
This publication represents the Proceedings of the 34th Annual Pan-Pacific Conference being held in Lima, Peru May 29-31, 2017. The Pan-Pacific Conference has served as an important forum for the exchange of ideas and information for promoting understanding and cooperation among the peoples of the world since 1984. Last year, we had a memorable conference in Miri, Malaysia, in cooperation with Curtin University Sarawak, under the theme of “Building a Smart Society through Innovation and Co-creation.” Professor Pauline Ho served as Chair of the Local Organizing Committee, with strong leadership support of Pro Vice-Chancellor Professor Jim Mienczakowski and Dean Jonathan Winterton.
This publication represents the Proceedings of the 34th Annual Pan-Pacific Conference being held in Lima, Peru May 29-31, 2017. The Pan-Pacific Conference has served as an important forum for the exchange of ideas and information for promoting understanding and cooperation among the peoples of the world since 1984. Last year, we had a memorable conference in Miri, Malaysia, in cooperation with Curtin University Sarawak, under the theme of “Building a Smart Society through Innovation and Co-creation.” Professor Pauline Ho served as Chair of the Local Organizing Committee, with strong leadership support of Pro Vice-Chancellor Professor Jim Mienczakowski and Dean Jonathan Winterton.

Create successful ePaper yourself
Turn your PDF publications into a flip-book with our unique Google optimized e-Paper software.
1.6<br />
1.5<br />
1.4<br />
1.3<br />
1.2<br />
1.1<br />
1<br />
0.9<br />
0.8<br />
0.7<br />
0.6<br />
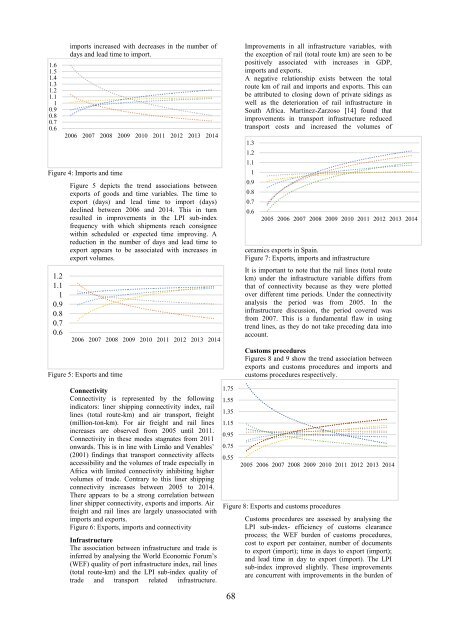
imports <strong>in</strong>creased with decreases <strong>in</strong> the number of<br />
days and lead time to import.<br />
Figure 4: Imports and time<br />
1.2<br />
1.1<br />
1<br />
0.9<br />
0.8<br />
0.7<br />
0.6<br />
2006 2007 2008 2009 2010 2011 2012 2013 2014<br />
Figure 5 depicts the trend associations between<br />
exports of goods and time variables. The time to<br />
export (days) and lead time to import (days)<br />
decl<strong>in</strong>ed between 2006 and 2014. This <strong>in</strong> turn<br />
resulted <strong>in</strong> improvements <strong>in</strong> the LPI sub-<strong>in</strong>dex<br />
frequency with which shipments reach consignee<br />
with<strong>in</strong> scheduled or expected time improv<strong>in</strong>g. A<br />
reduction <strong>in</strong> the number of days and lead time to<br />
export appears to be associated with <strong>in</strong>creases <strong>in</strong><br />
export volumes.<br />
2006 2007 2008 2009 2010 2011 2012 2013 2014<br />
Figure 5: Exports and time<br />
Connectivity<br />
Connectivity is represented by the follow<strong>in</strong>g<br />
<strong>in</strong>dicators: l<strong>in</strong>er shipp<strong>in</strong>g connectivity <strong>in</strong>dex, rail<br />
l<strong>in</strong>es (total route-km) and air transport, freight<br />
(million-ton-km). For air freight and rail l<strong>in</strong>es<br />
<strong>in</strong>creases are observed from 2005 until 2011.<br />
Connectivity <strong>in</strong> these modes stagnates from 2011<br />
onwards. This is <strong>in</strong> l<strong>in</strong>e with Limão and Venables’<br />
(2001) f<strong>in</strong>d<strong>in</strong>gs that transport connectivity affects<br />
accessibility and the volumes of trade especially <strong>in</strong><br />
Africa with limited connectivity <strong>in</strong>hibit<strong>in</strong>g higher<br />
volumes of trade. Contrary to this l<strong>in</strong>er shipp<strong>in</strong>g<br />
connectivity <strong>in</strong>creases between 2005 to 2014.<br />
There appears to be a strong correlation between<br />
l<strong>in</strong>er shipper connectivity, exports and imports. Air<br />
freight and rail l<strong>in</strong>es are largely unassociated with<br />
imports and exports.<br />
Figure 6: Exports, imports and connectivity<br />
Infrastructure<br />
The association between <strong>in</strong>frastructure and trade is<br />
<strong>in</strong>ferred by analys<strong>in</strong>g the World Economic Forum’s<br />
(WEF) quality of port <strong>in</strong>frastructure <strong>in</strong>dex, rail l<strong>in</strong>es<br />
(total route-km) and the LPI sub-<strong>in</strong>dex quality of<br />
trade and transport related <strong>in</strong>frastructure.<br />
1.75<br />
1.55<br />
1.35<br />
1.15<br />
0.95<br />
0.75<br />
0.55<br />
Improvements <strong>in</strong> all <strong>in</strong>frastructure variables, with<br />
the exception of rail (total route km) are seen to be<br />
positively associated with <strong>in</strong>creases <strong>in</strong> GDP,<br />
imports and exports.<br />
A negative relationship exists between the total<br />
route km of rail and imports and exports. This can<br />
be attributed to clos<strong>in</strong>g down of private sid<strong>in</strong>gs as<br />
well as the deterioration of rail <strong>in</strong>frastructure <strong>in</strong><br />
South Africa. Martínez-Zarzoso [14] found that<br />
improvements <strong>in</strong> transport <strong>in</strong>frastructure reduced<br />
transport costs and <strong>in</strong>creased the volumes of<br />
1.3<br />
1.2<br />
1.1<br />
1<br />
0.9<br />
0.8<br />
0.7<br />
0.6<br />
2005 2006 2007 2008 2009 2010 2011 2012 2013 2014<br />
ceramics exports <strong>in</strong> Spa<strong>in</strong>.<br />
Figure 7: Exports, imports and <strong>in</strong>frastructure<br />
It is important to note that the rail l<strong>in</strong>es (total route<br />
km) under the <strong>in</strong>frastructure variable differs from<br />
that of connectivity because as they were plotted<br />
over different time periods. Under the connectivity<br />
analysis the period was from 2005. In the<br />
<strong>in</strong>frastructure discussion, the period covered was<br />
from 2007. This is a fundamental flaw <strong>in</strong> us<strong>in</strong>g<br />
trend l<strong>in</strong>es, as they do not take preced<strong>in</strong>g data <strong>in</strong>to<br />
account.<br />
Customs procedures<br />
Figures 8 and 9 show the trend association between<br />
exports and customs procedures and imports and<br />
customs procedures respectively.<br />
2005 2006 2007 2008 2009 2010 2011 2012 2013 2014<br />
Figure 8: Exports and customs procedures<br />
Customs procedures are assessed by analys<strong>in</strong>g the<br />
LPI sub-<strong>in</strong>dex- efficiency of customs clearance<br />
process; the WEF burden of customs procedures,<br />
cost to export per conta<strong>in</strong>er, number of documents<br />
to export (import); time <strong>in</strong> days to export (import);<br />
and lead time <strong>in</strong> day to export (import). The LPI<br />
sub-<strong>in</strong>dex improved slightly. These improvements<br />
are concurrent with improvements <strong>in</strong> the burden of<br />
68