MOAC_Powerpoint_2016

You also want an ePaper? Increase the reach of your titles
YUMPU automatically turns print PDFs into web optimized ePapers that Google loves.
Using Charts in a Presentation 117<br />
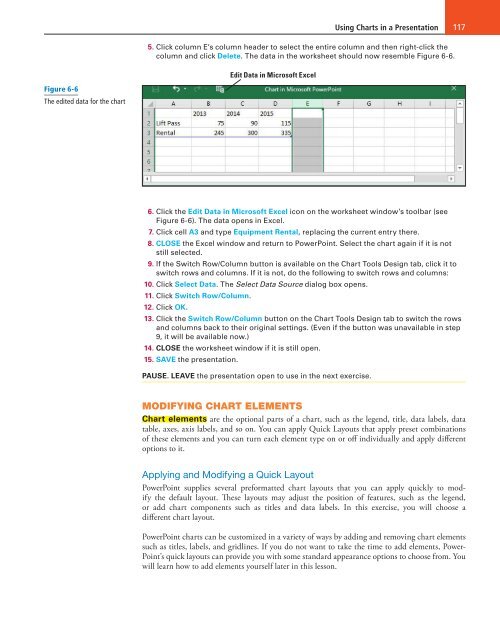
5. Click column E’s column header to select the entire column and then right-click the<br />
column and click Delete. The data in the worksheet should now resemble Figure 6-6.<br />
Edit Data in Microsoft Excel<br />
Figure 6-6<br />
The edited data for the chart<br />
6. Click the Edit Data in Microsoft Excel icon on the worksheet window’s toolbar (see<br />
Figure 6-6). The data opens in Excel.<br />
7. Click cell A3 and type Equipment Rental, replacing the current entry there.<br />
8. CLOSE the Excel window and return to PowerPoint. Select the chart again if it is not<br />
still selected.<br />
9. If the Switch Row/Column button is available on the Chart Tools Design tab, click it to<br />
switch rows and columns. If it is not, do the following to switch rows and columns:<br />
10. Click Select Data. The Select Data Source dialog box opens.<br />
11. Click Switch Row/Column.<br />
12. Click OK.<br />
13. Click the Switch Row/Column button on the Chart Tools Design tab to switch the rows<br />
and columns back to their original settings. (Even if the button was unavailable in step<br />
9, it will be available now.)<br />
14. CLOSE the worksheet window if it is still open.<br />
15. SAVE the presentation.<br />
PAUSE. LEAVE the presentation open to use in the next exercise.<br />
MODIFYING CHART ELEMENTS<br />
Chart elements are the optional parts of a chart, such as the legend, title, data labels, data<br />
table, axes, axis labels, and so on. You can apply Quick Layouts that apply preset combinations<br />
of these elements and you can turn each element type on or off individually and apply different<br />
options to it.<br />
Applying and Modifying a Quick Layout<br />
PowerPoint supplies several preformatted chart layouts that you can apply quickly to modify<br />
the default layout. These layouts may adjust the position of features, such as the legend,<br />
or add chart components such as titles and data labels. In this exercise, you will choose a<br />
different chart layout.<br />
PowerPoint charts can be customized in a variety of ways by adding and removing chart elements<br />
such as titles, labels, and gridlines. If you do not want to take the time to add elements, Power-<br />
Point’s quick layouts can provide you with some standard appearance options to choose from. You<br />
will learn how to add elements yourself later in this lesson.