MOAC_Powerpoint_2016

Create successful ePaper yourself
Turn your PDF publications into a flip-book with our unique Google optimized e-Paper software.
Creating SmartArt Graphics 125<br />
ADDING SMARTART TO A SLIDE<br />
Use the Insert a SmartArt Graphic icon in any content placeholder to start a new SmartArt<br />
graphic. After you have selected a type and a layout, you can add text to the SmartArt graphic.<br />
PowerPoint also lets you use existing bullet items to create SmartArt.<br />
Inserting a SmartArt Graphic<br />
SmartArt graphics (also called SmartArt diagrams, or just SmartArt) are visual representations<br />
of information you want to communicate. SmartArt shows items of related information in a<br />
graphical way that makes their relationships easy to understand. You can use SmartArt to present<br />
text information in a more visually interesting way than the usual bulleted or numbered formats.<br />
An organization chart is a type of SmartArt that shows the relationships among personnel or<br />
departments in an organization. Organization charts are included in the Hierarchy layouts. In this<br />
exercise, you will insert an organization chart.<br />
STEP BY STEP<br />
Create SmartArt<br />
GET READY. Before you begin these steps, make sure that your computer is on. Sign on, if<br />
necessary.<br />
1. START PowerPoint, if the program is not already running.<br />
2. OPEN the Litware presentation from the data files for this lesson and then SAVE it as<br />
Litware Final.<br />
3. Go to slide 3 and click the Insert a SmartArt Graphic icon in the center of the content<br />
placeholder. The Choose a SmartArt Graphic dialog box opens.<br />
4. Click Hierarchy in the type list in the left side of the dialog box. The layouts for the<br />
Hierarchy type are displayed.<br />
5. Click the first layout in the first row, the Organization Chart. Read the description of the<br />
Organization Chart layout in the right pane of the dialog box.<br />
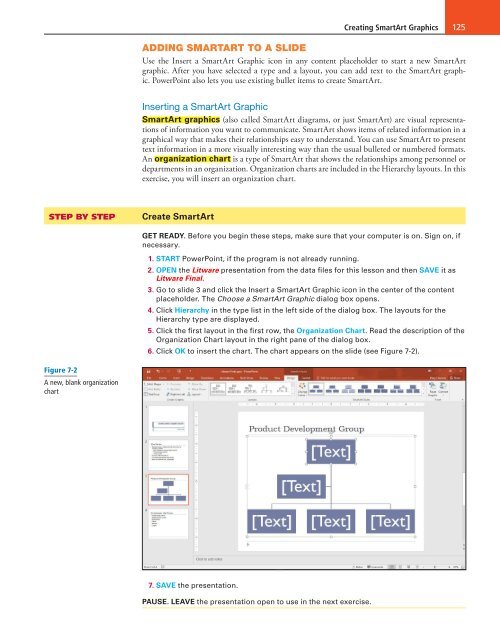
6. Click OK to insert the chart. The chart appears on the slide (see Figure 7-2).<br />
Figure 7-2<br />
A new, blank organization<br />
chart<br />
7. SAVE the presentation.<br />
PAUSE. LEAVE the presentation open to use in the next exercise.