- Page 1 and 2: MALAYSIA
- Page 6 and 7: STATUTORY REQUIREMENTS In accordanc
- Page 8 and 9: organisation level will further str
- Page 10 and 11: Besides analysis on productivity pe
- Page 12 and 13: CONTENTS MESSAGE FROM MINISTER vi S
- Page 14 and 15: CONTENTS PART 3: SYNERGY THROUGH PU
- Page 16 and 17: CONTENTS Chapter 8: Productivity Pe
- Page 18 and 19: REPORT HIGHLIGHTS PRODUCTIVITY PERF
- Page 20 and 21: The productivity of the services se
- Page 22 and 23: CHAPTER 1 PRODUCTIVITY PERFORMANCE
- Page 24 and 25: Figure 1.2: Productivity Growth by
- Page 26 and 27: for broadband services was also sup
- Page 28 and 29: The other services sub-sector recor
- Page 30 and 31: Manufacturing sector The productivi
- Page 32 and 33: productivity of the sector was impa
- Page 34 and 35: target to become a high-income econ
- Page 36: Towards A High Income Economy CHAPT
- Page 39: SOURCES OF MALAYSIA’S ECONOMIC GR
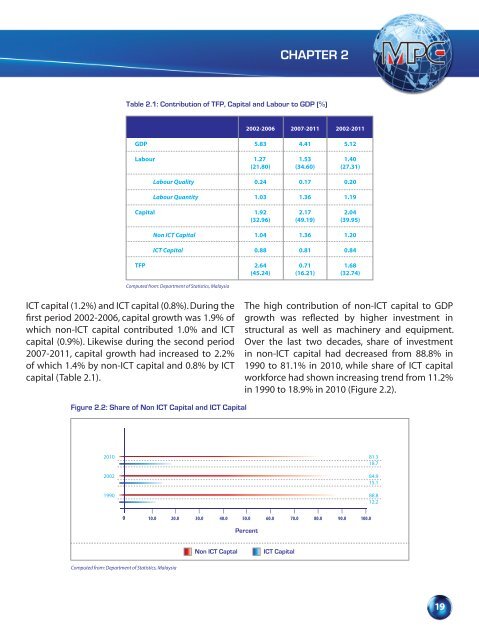
- Page 43 and 44: SOURCES OF MALAYSIA’S ECONOMIC GR
- Page 45 and 46: SOURCES OF MALAYSIA’S ECONOMIC GR
- Page 47 and 48: Box 2.1: Productivity Measurement U
- Page 49 and 50: 28 Productivity Report 2011/2012 Bo
- Page 52 and 53: CHAPTER 3 MALAYSIA AND INTERNATIONA
- Page 54 and 55: Chart 3.2: IMD Competitiveness Mode
- Page 56 and 57: Malaysia among the top 20 with coun
- Page 58 and 59: Figure 3.3: Economic Performance Ma
- Page 60 and 61: Figure 3.4: Government Efficiency E
- Page 62 and 63: Figure 3.5: Business Efficiency Ext
- Page 64 and 65: economies were already in the innov
- Page 66 and 67: BOX 3.1: CHARACTERISTICS OF INNOVAT
- Page 68 and 69: Characteristics of Selected Top Inn
- Page 70 and 71: CHAPTER 4 MODERNISING BUSINESS REGU
- Page 72 and 73: The Government took a significant s
- Page 74 and 75: egulations in addressing an identif
- Page 76 and 77: The Best Practice Regulation Handbo
- Page 78 and 79: Box 4.1: Enhancing Malaysia’s Com
- Page 80 and 81: Government Agency : Certi�cation
- Page 82 and 83: START NFP Plan Verification OSC DBK
- Page 84: The following improvements are reco
- Page 87 and 88: ESCALATING ENTERPRISE INNOVATION AN
- Page 89 and 90: ESCALATING ENTERPRISE INNOVATION AN
- Page 91 and 92:
ESCALATING ENTERPRISE INNOVATION AN
- Page 93 and 94:
ESCALATING ENTERPRISE INNOVATION AN
- Page 95 and 96:
ESCALATING ENTERPRISE INNOVATION AN
- Page 97 and 98:
ESCALATING ENTERPRISE INNOVATION AN
- Page 99 and 100:
ESCALATING ENTERPRISE INNOVATION AN
- Page 101 and 102:
Box 5.1: Knowledge Content Study in
- Page 103 and 104:
Efficient delivery time is vital to
- Page 105 and 106:
Group A (North) China Hong Kong Jap
- Page 107 and 108:
. ICQCC 2011, YOKOHAMA, JAPAN 11 th
- Page 109 and 110:
Over production is caused by: • I
- Page 111 and 112:
Box 5.4: Green Productivity (GP) fo
- Page 113 and 114:
Box 5.5: Enhancing Productivity thr
- Page 115 and 116:
Box 5.6: Achieving Excellence throu
- Page 117 and 118:
PART 3 SYNERGY THROUGH PUBLIC-PRIVA
- Page 119 and 120:
PRODUCTIVITY PERFORMANCE OF THE SER
- Page 121 and 122:
PRODUCTIVITY PERFORMANCE OF THE SER
- Page 123 and 124:
PRODUCTIVITY PERFORMANCE OF THE SER
- Page 125 and 126:
PRODUCTIVITY PERFORMANCE OF THE SER
- Page 127 and 128:
PRODUCTIVITY PERFORMANCE OF THE SER
- Page 129 and 130:
PRODUCTIVITY PERFORMANCE OF THE SER
- Page 131 and 132:
PRODUCTIVITY PERFORMANCE OF THE SER
- Page 133 and 134:
PRODUCTIVITY PERFORMANCE OF THE SER
- Page 135 and 136:
PRODUCTIVITY PERFORMANCE OF THE SER
- Page 137 and 138:
PRODUCTIVITY PERFORMANCE OF THE SER
- Page 139 and 140:
PRODUCTIVITY PERFORMANCE OF THE SER
- Page 141 and 142:
PRODUCTIVITY PERFORMANCE OF THE SER
- Page 143 and 144:
PRODUCTIVITY PERFORMANCE OF THE SER
- Page 145 and 146:
PRODUCTIVITY PERFORMANCE OF THE SER
- Page 147 and 148:
PRODUCTIVITY PERFORMANCE OF THE SER
- Page 149 and 150:
PRODUCTIVITY PERFORMANCE OF THE SER
- Page 151 and 152:
PRODUCTIVITY PERFORMANCE OF THE SER
- Page 153 and 154:
PRODUCTIVITY PERFORMANCE OF THE SER
- Page 155 and 156:
PRODUCTIVITY PERFORMANCE OF THE SER
- Page 157 and 158:
PRODUCTIVITY PERFORMANCE OF THE SER
- Page 159 and 160:
PRODUCTIVITY PERFORMANCE OF THE SER
- Page 161 and 162:
PRODUCTIVITY PERFORMANCE OF THE SER
- Page 163 and 164:
PRODUCTIVITY PERFORMANCE OF THE SER
- Page 165 and 166:
PRODUCTIVITY PERFORMANCE OF THE SER
- Page 167 and 168:
Box 6.1: Benchmarking for Education
- Page 169 and 170:
Box 6.2: Measuring Performance of P
- Page 171 and 172:
Box 6.3: Building Information Model
- Page 174 and 175:
CHAPTER 7 PRODUCTIVITY PERFORMANCE
- Page 176 and 177:
quarter of the year, the global sup
- Page 178 and 179:
CHAPTER 7 Figure 7.3: Productivity
- Page 180 and 181:
Figure 7.6 shows that labour remune
- Page 182 and 183:
increased to RM35,300 million in 20
- Page 184 and 185:
enable the sub-sector to face signi
- Page 186 and 187:
cost per employee had significantly
- Page 188 and 189:
The industry experienced a nominal
- Page 190 and 191:
CHAPTER 7 Figure 7.10: TFP Growth o
- Page 192 and 193:
in particular E&E. This sub-sector
- Page 194:
Furthermore, it can be observed tha
- Page 197 and 198:
PRODUCTIVITY PERFORMANCE OF THE AGR
- Page 199 and 200:
PRODUCTIVITY PERFORMANCE OF THE AGR
- Page 201 and 202:
PRODUCTIVITY PERFORMANCE OF THE AGR
- Page 203 and 204:
PRODUCTIVITY PERFORMANCE OF THE AGR
- Page 205 and 206:
PRODUCTIVITY PERFORMANCE OF THE AGR
- Page 207 and 208:
PRODUCTIVITY PERFORMANCE OF THE AGR
- Page 209 and 210:
PRODUCTIVITY PERFORMANCE OF THE AGR
- Page 211 and 212:
PRODUCTIVITY PERFORMANCE OF THE AGR
- Page 213 and 214:
PRODUCTIVITY PERFORMANCE OF THE AGR
- Page 215 and 216:
Box 8.1: Innovative Farming Practic
- Page 217 and 218:
PART 4 SUSTAINING THE QUALITY OF LI
- Page 219 and 220:
NATION’S QUALITY OF LIFE ASPIRATI
- Page 221 and 222:
NATION’S QUALITY OF LIFE ASPIRATI
- Page 223 and 224:
NATION’S QUALITY OF LIFE ASPIRATI
- Page 225 and 226:
NATION’S QUALITY OF LIFE ASPIRATI
- Page 227 and 228:
Sources: Preliminary Report, Malays
- Page 229 and 230:
NATION’S QUALITY OF LIFE ASPIRATI
- Page 231 and 232:
NATION’S QUALITY OF LIFE ASPIRATI
- Page 233 and 234:
NATION’S QUALITY OF LIFE ASPIRATI
- Page 235 and 236:
NATION’S QUALITY OF LIFE ASPIRATI
- Page 237 and 238:
NATION’S QUALITY OF LIFE ASPIRATI
- Page 239 and 240:
Box 9.1: Best Practices in Work Lif
- Page 241 and 242:
Box 9.2: National Customer Satisfac
- Page 243 and 244:
Application of National Customer Sa
- Page 246 and 247:
APPENDICES
- Page 248 and 249:
APPENDIX A - PRODUCTIVITY ii. Subtr
- Page 250 and 251:
APPENDIX A - PRODUCTIVITY 8.2 Labou
- Page 252 and 253:
APPENDIX A - PRODUCTIVITY 8.5 Proce
- Page 254 and 255:
APPENDIX C - COMPETITIVENESS TERMIN
- Page 256 and 257:
APPENDIX D - REGULATORY REVIEW TERM
- Page 258 and 259:
APPENDIX D - REGULATORY REVIEW Nati
- Page 260 and 261:
APPENDIX E - TECHNICAL NOTES TERMIN
- Page 262 and 263:
APPENDIX E - TECHNICAL NOTES Output
- Page 264 and 265:
APPENDIX E - TECHNICAL NOTES 243
- Page 266 and 267:
APPENDIX F - CONTRIBUTION BY SUB-SE
- Page 268 and 269:
MPC CONSULTATIVE PANELS CONSULTATIV
- Page 270 and 271:
MPC CONSULTATIVE PANELS CONSULTATIV
- Page 272 and 273:
PARTNERSHIP Economic Planning Unit
- Page 274 and 275:
MPC CONSULTATIVE OFFICE ADDRESSES P
- Page 276 and 277:
MPC REFERENCES CONSULTATIVE PANELS
- Page 278 and 279:
MPC ACRONYMS CONSULTATIVE AND ABBRE
- Page 280 and 281:
MPC ACRONYMS CONSULTATIVE AND ABBRE
- Page 282 and 283:
INDEX Culture 28, 46, 47, 67, 71, 7
- Page 284 and 285:
INDEX Malcolm Baldrige National Qua
- Page 286:
TRANSFORMATION INNOVATION PARTNERSH