Annual Report 2009/10 Excellence in Retailing - Douglas Holding
Annual Report 2009/10 Excellence in Retailing - Douglas Holding
Annual Report 2009/10 Excellence in Retailing - Douglas Holding

You also want an ePaper? Increase the reach of your titles
YUMPU automatically turns print PDFs into web optimized ePapers that Google loves.
112 F<strong>in</strong>ancial statements<br />
Facts & figures<br />
Consolidated <strong>in</strong>come statement<br />
Consolidated balance sheet<br />
Statement of changes <strong>in</strong> Group equity<br />
Segment report<strong>in</strong>g<br />
Consolidated Cash Flow statement<br />
Notes<br />
Notes to the <strong>in</strong>come statement<br />
Notes to the balance sheet<br />
Auditor’s report<br />
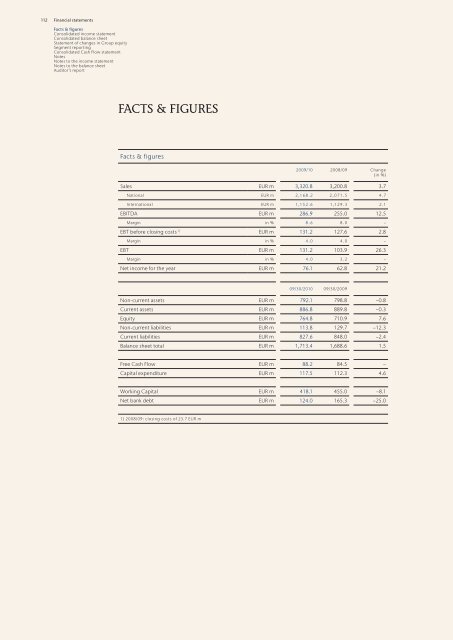
FACTS & FIGURES<br />
Facts & figures<br />
<strong>2009</strong>/<strong>10</strong> 2008/09 Change<br />
(<strong>in</strong> %)<br />
Sales EUR m 3,320.8 3,200.8 3.7<br />
National EUR m 2,168.2 2,071.5 4.7<br />
International EUR m 1,152.6 1,129.3 2.1<br />
EBITDA EUR m 286.9 255.0 12.5<br />
Marg<strong>in</strong> <strong>in</strong> % 8.6 8.0 −<br />
EBT before clos<strong>in</strong>g costs 1) EUR m 131.2 127.6 2.8<br />
Marg<strong>in</strong> <strong>in</strong> % 4.0 4.0 −<br />
EBT EUR m 131.2 <strong>10</strong>3.9 26.3<br />
Marg<strong>in</strong> <strong>in</strong> % 4.0 3.2 −<br />
Net <strong>in</strong>come for the year EUR m 76.1 62.8 21.2<br />
09/30/20<strong>10</strong> 09/30/<strong>2009</strong><br />
Non-current assets EUR m 792.1 798.8 −0.8<br />
Current assets EUR m 886.8 889.8 −0.3<br />
Equity EUR m 764.8 7<strong>10</strong>.9 7.6<br />
Non-current liabilities EUR m 113.8 129.7 −12.3<br />
Current liabilities EUR m 827.6 848.0 −2.4<br />
Balance sheet total EUR m 1,713.4 1,688.6 1.5<br />
Free Cash Flow EUR m 88.2 84.5 −<br />
Capital expenditure EUR m 117.5 112.3 4.6<br />
Work<strong>in</strong>g Capital EUR m 418.1 455.0 −8.1<br />
Net bank debt EUR m 124.0 165.3 −25.0<br />
1) 2008/09: clos<strong>in</strong>g costs of 23.7 EUR m