Annual Report 2009/10 Excellence in Retailing - Douglas Holding
Annual Report 2009/10 Excellence in Retailing - Douglas Holding
Annual Report 2009/10 Excellence in Retailing - Douglas Holding

You also want an ePaper? Increase the reach of your titles
YUMPU automatically turns print PDFs into web optimized ePapers that Google loves.
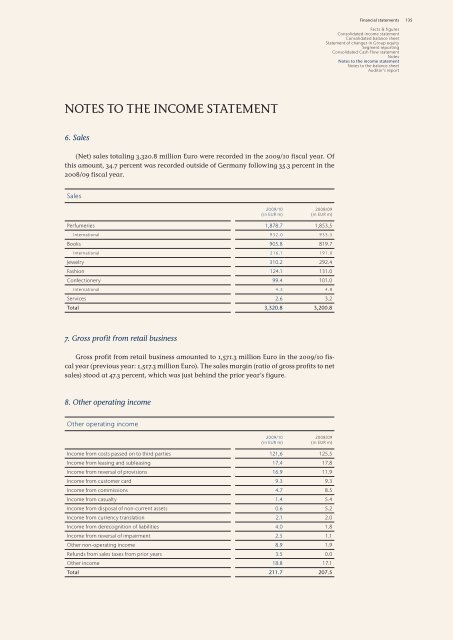
NOTES TO THE INCOME STATEMENT<br />
6. Sales<br />
(Net) sales total<strong>in</strong>g 3,320.8 million Euro were recorded <strong>in</strong> the <strong>2009</strong>/<strong>10</strong> fiscal year. Of<br />
this amount, 34.7 percent was recorded outside of Germany follow<strong>in</strong>g 35.3 percent <strong>in</strong> the<br />
2008/09 fiscal year.<br />
Sales<br />
<strong>2009</strong>/<strong>10</strong><br />
(<strong>in</strong> EUR m)<br />
2008/09<br />
(<strong>in</strong> EUR m)<br />
Perfumeries 1,878.7 1,853.5<br />
International 932.0 933.5<br />
Books 905.8 819.7<br />
International 216.1 191.0<br />
Jewelry 3<strong>10</strong>.2 292.4<br />
Fashion 124.1 131.0<br />
Confectionery 99.4 <strong>10</strong>1.0<br />
International 4.5 4.8<br />
Services 2.6 3.2<br />
Total 3,320.8 3,200.8<br />
7. Gross profit from retail bus<strong>in</strong>ess<br />
Gross profit from retail bus<strong>in</strong>ess amounted to 1,571.3 million Euro <strong>in</strong> the <strong>2009</strong>/<strong>10</strong> fiscal<br />
year (previous year: 1,517.3 million Euro). The sales marg<strong>in</strong> (ratio of gross profits to net<br />
sales) stood at 47.3 percent, which was just beh<strong>in</strong>d the prior year’s figure.<br />
8. Other operat<strong>in</strong>g <strong>in</strong>come<br />
Other operat<strong>in</strong>g <strong>in</strong>come<br />
<strong>2009</strong>/<strong>10</strong><br />
(<strong>in</strong> EUR m)<br />
2008/09<br />
(<strong>in</strong> EUR m)<br />
Income from costs passed on to third parties 121,6 125.5<br />
Income from leas<strong>in</strong>g and subleas<strong>in</strong>g 17.4 17.8<br />
Income from reversal of provisions 16.9 11.9<br />
Income from customer card 9.3 9.3<br />
Income from commissions 4.7 8.5<br />
Income from casualty 1.4 5.4<br />
Income from disposal of non-current assets 0.6 5.2<br />
Income from currency translation 2.1 2.0<br />
Income from derecognition of liabilities 4.0 1.8<br />
Income from reversal of impairment 2.5 1.1<br />
Other non-operat<strong>in</strong>g <strong>in</strong>come 8.9 1.9<br />
Refunds from sales taxes from prior years 3.5 0.0<br />
Other <strong>in</strong>come 18.8 17.1<br />
Total 211.7 207.5<br />
F<strong>in</strong>ancial statements<br />
Facts & figures<br />
Consolidated <strong>in</strong>come statement<br />
Consolidated balance sheet<br />
Statement of changes <strong>in</strong> Group equity<br />
Segment report<strong>in</strong>g<br />
Consolidated Cash Flow statement<br />
Notes<br />
Notes to the <strong>in</strong>come statement<br />
Notes to the balance sheet<br />
Auditor’s report<br />
135