Annual Report 2009/10 Excellence in Retailing - Douglas Holding
Annual Report 2009/10 Excellence in Retailing - Douglas Holding
Annual Report 2009/10 Excellence in Retailing - Douglas Holding

You also want an ePaper? Increase the reach of your titles
YUMPU automatically turns print PDFs into web optimized ePapers that Google loves.
128 F<strong>in</strong>ancial statements<br />
Facts & figures<br />
Consolidated <strong>in</strong>come statement<br />
Consolidated balance sheet<br />
Statement of changes <strong>in</strong> Group equity<br />
Segment report<strong>in</strong>g<br />
Consolidated Cash Flow statement<br />
Notes<br />
Notes to the <strong>in</strong>come statement<br />
Notes to the balance sheet<br />
Auditor’s report<br />
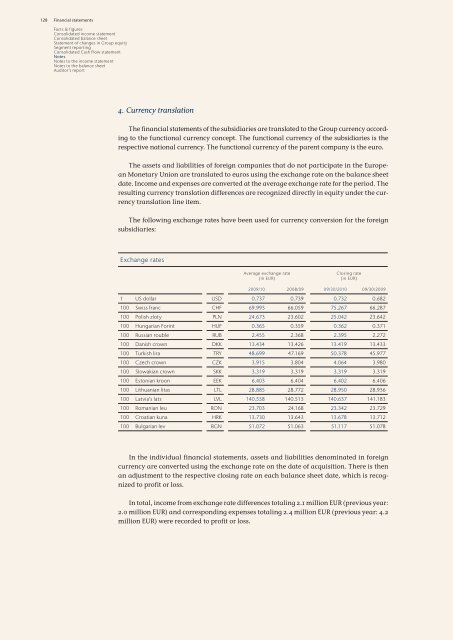
4. Currency translation<br />
The f<strong>in</strong>ancial statements of the subsidiaries are translated to the Group currency accord<strong>in</strong>g<br />
to the functional currency concept. The functional currency of the subsidiaries is the<br />
respective national currency. The functional currency of the parent company is the euro.<br />
The assets and liabilities of foreign companies that do not participate <strong>in</strong> the European<br />
Monetary Union are translated to euros us<strong>in</strong>g the exchange rate on the balance sheet<br />
date. Income and expenses are converted at the average exchange rate for the period. The<br />
result<strong>in</strong>g currency translation differences are recognized directly <strong>in</strong> equity under the currency<br />
translation l<strong>in</strong>e item.<br />
The follow<strong>in</strong>g exchange rates have been used for currency conversion for the foreign<br />
subsidiaries:<br />
Exchange rates<br />
Average exchange rate<br />
(<strong>in</strong> EUR)<br />
Clos<strong>in</strong>g rate<br />
(<strong>in</strong> EUR)<br />
<strong>2009</strong>/<strong>10</strong> 2008/09 09/30/20<strong>10</strong> 09/30/<strong>2009</strong><br />
1 US dollar USD 0.737 0.739 0.732 0.682<br />
<strong>10</strong>0 Swiss franc CHF 69.993 66.059 75.267 66.287<br />
<strong>10</strong>0 Polish zloty PLN 24.673 23.602 25.042 23.642<br />
<strong>10</strong>0 Hungarian For<strong>in</strong>t HUF 0.365 0.359 0.362 0.371<br />
<strong>10</strong>0 Russian rouble RUB 2.455 2.368 2.395 2.272<br />
<strong>10</strong>0 Danish crown DKK 13.434 13.426 13.419 13.433<br />
<strong>10</strong>0 Turkish lira TRY 48.699 47.169 50.378 45.977<br />
<strong>10</strong>0 Czech crown CZK 3.915 3.804 4.064 3.980<br />
<strong>10</strong>0 Slowakian crown SKK 3.319 3.319 3.319 3.319<br />
<strong>10</strong>0 Estonian kroon EEK 6.403 6.404 6.402 6.406<br />
<strong>10</strong>0 Lithuanian litas LTL 28.885 28.772 28.950 28.936<br />
<strong>10</strong>0 Latvia’s lats LVL 140.558 140.513 140.637 141.183<br />
<strong>10</strong>0 Romanian leu RON 23.703 24.168 23.342 23.729<br />
<strong>10</strong>0 Croatian kuna HRK 13.730 13.643 13.678 13.712<br />
<strong>10</strong>0 Bulgarian lev BGN 51.072 51.063 51.117 51.078<br />
In the <strong>in</strong>dividual f<strong>in</strong>ancial statements, assets and liabilities denom<strong>in</strong>ated <strong>in</strong> foreign<br />
currency are converted us<strong>in</strong>g the exchange rate on the date of acquisition. There is then<br />
an adjustment to the respective clos<strong>in</strong>g rate on each balance sheet date, which is recognized<br />
to profit or loss.<br />
In total, <strong>in</strong>come from exchange rate differences total<strong>in</strong>g 2.1 million EUR (previous year:<br />
2.0 million EUR) and correspond<strong>in</strong>g expenses total<strong>in</strong>g 2.4 million EUR (previous year: 4.2<br />
million EUR) were recorded to profit or loss.