Annual Report 2009/10 Excellence in Retailing - Douglas Holding
Annual Report 2009/10 Excellence in Retailing - Douglas Holding
Annual Report 2009/10 Excellence in Retailing - Douglas Holding

You also want an ePaper? Increase the reach of your titles
YUMPU automatically turns print PDFs into web optimized ePapers that Google loves.
DVA calculation<br />
Based on the premise that the DOUGLAS Group and its <strong>in</strong>dividual subsidiaries only<br />
generate value if the required cost of capital employed is at least covered by their earn<strong>in</strong>gs,<br />
the DVA is calculated by subtract<strong>in</strong>g the imputed f<strong>in</strong>ancial costs of capital employed from<br />
the net operat<strong>in</strong>g profit after taxes (NOPAT). The NOPAT is the operat<strong>in</strong>g profit before f<strong>in</strong>anc<strong>in</strong>g<br />
costs m<strong>in</strong>us <strong>in</strong>come taxes. Capital employed is the total of all assets m<strong>in</strong>us all non<strong>in</strong>terest<br />
bear<strong>in</strong>g liabilities plus the allocable present value of rental and lease obligations.<br />
The capital employed is calculated based on the average of the four quarters of a fiscal year.<br />
The DOUGLAS Group’s cost of capital is derived from the weighted average cost of<br />
capital (WACC) concept. As <strong>in</strong> the preced<strong>in</strong>g year, this amounted to 6.5 percent after taxes<br />
for the DOUGLAS Group <strong>in</strong> the year under review. This takes <strong>in</strong>to account <strong>in</strong>terest for<br />
both lenders and <strong>in</strong>vestors. The cost of equity is calculated us<strong>in</strong>g the capital asset pric<strong>in</strong>g<br />
model (CAPM). In addition to the absolute DVA of the period, the Delta DVA is also a key<br />
performance <strong>in</strong>dicator. This illustrates whether, and the extent to which, the DVA could<br />
be <strong>in</strong>creased <strong>in</strong> comparison to the preced<strong>in</strong>g year.<br />
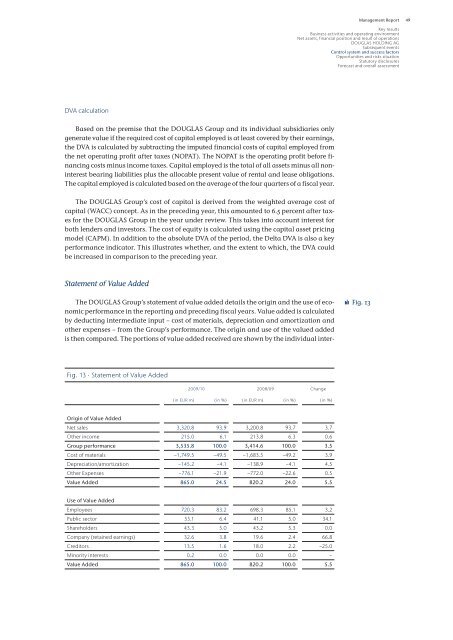
Statement of Value Added<br />
The DOUGLAS Group’s statement of value added details the orig<strong>in</strong> and the use of economic<br />
performance <strong>in</strong> the report<strong>in</strong>g and preced<strong>in</strong>g fiscal years. Value added is calculated<br />
by deduct<strong>in</strong>g <strong>in</strong>termediate <strong>in</strong>put – cost of materials, depreciation and amortization and<br />
other expenses – from the Group’s performance. The orig<strong>in</strong> and use of the valued added<br />
is then compared. The portions of value added received are shown by the <strong>in</strong>dividual <strong>in</strong>ter-<br />
Fig. 13 · Statement of Value Added<br />
<strong>2009</strong>/<strong>10</strong> 2008/09 Change<br />
(<strong>in</strong> EUR m) (<strong>in</strong> %) (<strong>in</strong> EUR m) (<strong>in</strong> %) (<strong>in</strong> %)<br />
Orig<strong>in</strong> of Value Added<br />
Net sales 3,320.8 93.9 3,200.8 93.7 3.7<br />
Other <strong>in</strong>come 215.0 6.1 213.8 6.3 0.6<br />
Group performance 3,535.8 <strong>10</strong>0.0 3,414.6 <strong>10</strong>0.0 3.5<br />
Cost of materials −1,749.5 −49.5 −1,683.5 −49.2 3.9<br />
Depreciation/amortization −145.2 −4.1 −138.9 −4.1 4.5<br />
Other Expenses −776.1 −21.9 −772.0 −22.6 0.5<br />
Value Added 865.0 24.5 820.2 24.0 5.5<br />
Use of Value Added<br />
Employees 720.3 83.2 698.3 85.1 3.2<br />
Public sector 55.1 6.4 41.1 5.0 34.1<br />
Shareholders 43.3 5.0 43.2 5.3 0.0<br />
Company (reta<strong>in</strong>ed earn<strong>in</strong>gs) 32.6 3.8 19.6 2.4 66.8<br />
Creditors 13.5 1.6 18.0 2.2 −25.0<br />
M<strong>in</strong>ority <strong>in</strong>terests 0.2 0.0 0.0 0.0 −<br />
Value Added 865.0 <strong>10</strong>0.0 820.2 <strong>10</strong>0.0 5.5<br />
Management <strong>Report</strong><br />
Key results<br />
Bus<strong>in</strong>ess activities and operat<strong>in</strong>g environment<br />
Net assets, f<strong>in</strong>ancial position and result of operations<br />
DOUGLAS HOLDING AG<br />
Subsequent events<br />
Control system and success factors<br />
Opportunities and risks situation<br />
Statutory disclosures<br />
Forecast and overall assessment<br />
Fig. 13<br />
49