Annual Report 2009/10 Excellence in Retailing - Douglas Holding
Annual Report 2009/10 Excellence in Retailing - Douglas Holding
Annual Report 2009/10 Excellence in Retailing - Douglas Holding

Create successful ePaper yourself
Turn your PDF publications into a flip-book with our unique Google optimized e-Paper software.
176 Further <strong>in</strong>formation<br />
Overview<br />
Glossary<br />
F<strong>in</strong>ancial calendar/Credits<br />
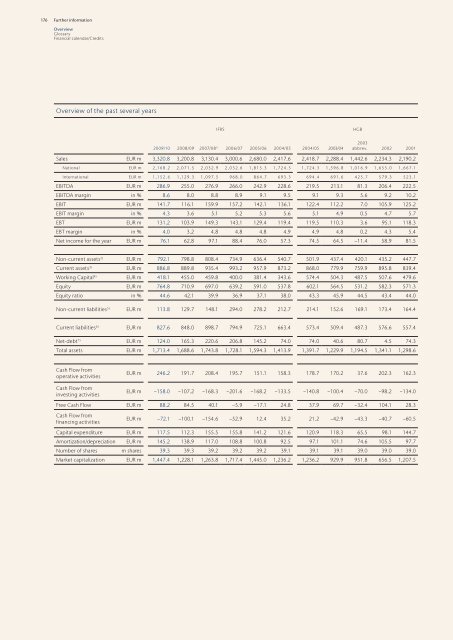
Overview of the past several years<br />
IFRS HGB<br />
<strong>2009</strong>/<strong>10</strong> 2008/09 2007/08 1) 2006/07 2005/06 2004/05 2004/05 2003/04<br />
2003<br />
abbrev. 2002 2001<br />
Sales EUR m 3,320.8 3,200.8 3,130.4 3,000.6 2,680.0 2,417.6 2,418.7 2,288.4 1,442.6 2,234.3 2,190.2<br />
National EUR m 2,168.2 2,071.5 2,032.9 2,032.6 1,815.3 1,724.3 1,724.3 1,596.8 1,016.9 1,655.0 1,667.1<br />
International EUR m 1,152.6 1,129.3 1,097.5 968.0 864.7 693.3 694.4 691.6 425.7 579.3 523.1<br />
EBITDA EUR m 286.9 255.0 276.9 266.0 242.9 228.6 219.5 213.1 81.3 206.4 222.5<br />
EBITDA marg<strong>in</strong> <strong>in</strong> % 8.6 8.0 8.8 8.9 9.1 9.5 9.1 9.3 5.6 9.2 <strong>10</strong>.2<br />
EBIT EUR m 141.7 116.1 159.9 157.2 142.1 136.1 122.4 112.2 7.0 <strong>10</strong>5.9 125.2<br />
EBIT marg<strong>in</strong> <strong>in</strong> % 4.3 3.6 5.1 5.2 5.3 5.6 5.1 4.9 0.5 4.7 5.7<br />
EBT EUR m 131.2 <strong>10</strong>3.9 149.3 143.1 129.4 119.4 119.5 1<strong>10</strong>.3 3.6 95.1 118.3<br />
EBT marg<strong>in</strong> <strong>in</strong> % 4.0 3.2 4.8 4.8 4.8 4.9 4.9 4.8 0.2 4.3 5.4<br />
Net <strong>in</strong>come for the year EUR m 76.1 62.8 97.1 88.4 76.0 57.3 74.5 64.5 −11.4 58.9 81.5<br />
Non-current assets2) EUR m 792.1 798.8 808.4 734.9 636.4 540.7 501.9 437.4 420.1 435.2 447.7<br />
Current assets3) EUR m 886.8 889.8 935.4 993.2 957.9 873.2 868.0 779.9 759.9 895.8 839.4<br />
Work<strong>in</strong>g Capital4) EUR m 418.1 455.0 459.8 400.0 381.4 343.6 574.4 504.3 487.5 507.6 479.6<br />
Equity EUR m 764.8 7<strong>10</strong>.9 697.0 639.2 591.0 537.8 602.1 564.5 531.2 582.3 571.3<br />
Equity ratio <strong>in</strong> % 44.6 42.1 39.9 36.9 37.1 38.0 43.3 45.9 44.5 43.4 44.0<br />
Non-current liabilities 5) EUR m 113.8 129.7 148.1 294.0 278.2 212.7 214.1 152.6 169.1 173.4 164.4<br />
Current liabilities 6) EUR m 827.6 848.0 898.7 794.9 725.1 663.4 573.4 509.4 487.3 576.6 557.4<br />
Net-debt7) EUR m 124.0 165.3 220.6 206.8 145.2 74.0 74.0 40.6 80.7 4.5 74.3<br />
Total assets EUR m 1,713.4 1,688.6 1,743.8 1,728.1 1,594.3 1,413.9 1,391.7 1,229.9 1,194.5 1,341.1 1,298.6<br />
Cash Flow from<br />
operative activities<br />
EUR m 246.2 191.7 208.4 195.7 151.1 158.3 178.7 170.2 37.6 202.3 162.3<br />
Cash Flow from<br />
<strong>in</strong>vest<strong>in</strong>g activities<br />
EUR m −158.0 −<strong>10</strong>7.2 −168.3 −201.6 −168.2 −133.5 −140.8 −<strong>10</strong>0.4 −70.0 −98.2 −134.0<br />
Free Cash Flow EUR m 88.2 84.5 40.1 −5.9 −17.1 24.8 37.9 69.7 −32.4 <strong>10</strong>4.1 28.3<br />
Cash Flow from<br />
f<strong>in</strong>anc<strong>in</strong>g activities<br />
EUR m −72.1 −<strong>10</strong>0.1 −154.6 −52.9 12.4 35.2 21.2 −42.9 −43.3 −40.7 −60.5<br />
Capital expenditure EUR m 117.5 112.3 155.5 155.8 141.2 121.6 120.9 118.3 65.5 98.1 144.7<br />
Amortization/depreciation EUR m 145.2 138.9 117.0 <strong>10</strong>8.8 <strong>10</strong>0.8 92.5 97.1 <strong>10</strong>1.1 74.6 <strong>10</strong>5.5 97.7<br />
Number of shares m shares 39.3 39.3 39.2 39.2 39.2 39.1 39.1 39.1 39.0 39.0 39.0<br />
Market capitalization EUR m 1,447.4 1,228.1 1,263.8 1,717.4 1,445.0 1,236.2 1,236.2 929.9 951.8 656.5 1,207.5