Annual Report 2009/10 Excellence in Retailing - Douglas Holding
Annual Report 2009/10 Excellence in Retailing - Douglas Holding
Annual Report 2009/10 Excellence in Retailing - Douglas Holding

Create successful ePaper yourself
Turn your PDF publications into a flip-book with our unique Google optimized e-Paper software.
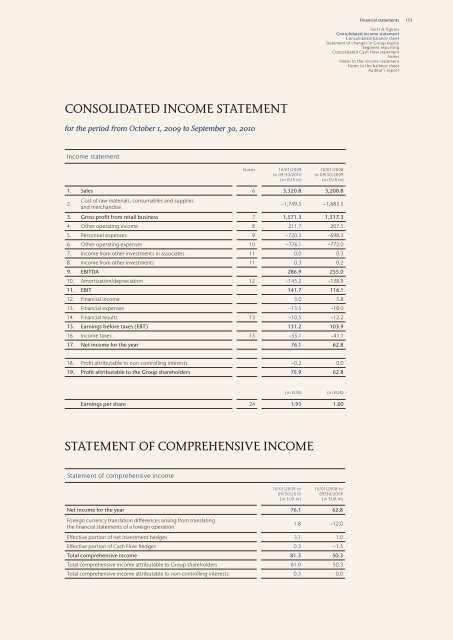
CONSOLIDATED INCOME STATEMENT<br />
for the period from October 1, <strong>2009</strong> to September 30, 20<strong>10</strong><br />
Income statement<br />
Notes <strong>10</strong>/01/<strong>2009</strong><br />
to 09/30/20<strong>10</strong><br />
(<strong>in</strong> EUR m)<br />
<strong>10</strong>/01/2008<br />
to 09/30/<strong>2009</strong><br />
(<strong>in</strong> EUR m)<br />
1. Sales 6 3,320.8 3,200.8<br />
2.<br />
Cost of raw materials, consumables and supplies<br />
and merchandise<br />
−1,749.5 −1,683.5<br />
3. Gross profit from retail bus<strong>in</strong>ess 7 1,571.3 1,517.3<br />
4. Other operat<strong>in</strong>g <strong>in</strong>come 8 211.7 207.5<br />
5. Personnel expenses 9 −720.3 −698.3<br />
6. Other operat<strong>in</strong>g expenses <strong>10</strong> −776.1 −772.0<br />
7. Income from other <strong>in</strong>vestments <strong>in</strong> associates 11 0.0 0.3<br />
8. Income from other <strong>in</strong>vestments 11 0.3 0.2<br />
9. EBITDA 286.9 255.0<br />
<strong>10</strong>. Amortization/depreciation 12 −145.2 −138.9<br />
11. EBIT 141.7 116.1<br />
12. F<strong>in</strong>ancial <strong>in</strong>come 3.0 5.8<br />
13. F<strong>in</strong>ancial expenses −13.5 −18.0<br />
14. F<strong>in</strong>ancial results 13 −<strong>10</strong>.5 −12.2<br />
15. Earn<strong>in</strong>gs before taxes (EBT) 131.2 <strong>10</strong>3.9<br />
16. Income taxes 15 −55.1 −41.1<br />
17. Net <strong>in</strong>come for the year 76.1 62.8<br />
18. Profit attributable to non-controll<strong>in</strong>g <strong>in</strong>terests −0.2 0.0<br />
19. Profit attributable to the Group shareholders 75.9 62.8<br />
(<strong>in</strong> EUR) (<strong>in</strong> EUR)<br />
Earn<strong>in</strong>gs per share 24 1.93 1.60<br />
STATEMENT OF COMPREHENSIVE INCOME<br />
Statement of comprehensive <strong>in</strong>come<br />
<strong>10</strong>/01/<strong>2009</strong> to<br />
09/30/20<strong>10</strong><br />
(<strong>in</strong> EUR m)<br />
<strong>10</strong>/01/2008 to<br />
09/30/<strong>2009</strong><br />
(<strong>in</strong> EUR m)<br />
Net <strong>in</strong>come for the year 76.1 62.8<br />
Foreign currency translation differences aris<strong>in</strong>g from translat<strong>in</strong>g<br />
the f<strong>in</strong>ancial statements of a foreign operation<br />
1.8 −12.0<br />
Effective portion of net <strong>in</strong>vestment hedges 3.1 1.0<br />
Effective portion of Cash Flow hedges 0.3 −1.5<br />
Total comprehensive <strong>in</strong>come 81.3 50.3<br />
Total comprehensive <strong>in</strong>come attributable to Group shareholders 81.0 50.3<br />
Total comprehensive <strong>in</strong>come attributable to non-controll<strong>in</strong>g <strong>in</strong>terests 0.3 0.0<br />
F<strong>in</strong>ancial statements<br />
Facts & figures<br />
Consolidated <strong>in</strong>come statement<br />
Consolidated balance sheet<br />
Statement of changes <strong>in</strong> Group equity<br />
Segment report<strong>in</strong>g<br />
Consolidated Cash Flow statement<br />
Notes<br />
Notes to the <strong>in</strong>come statement<br />
Notes to the balance sheet<br />
Auditor’s report<br />
113