Annual Report 2009/10 Excellence in Retailing - Douglas Holding
Annual Report 2009/10 Excellence in Retailing - Douglas Holding
Annual Report 2009/10 Excellence in Retailing - Douglas Holding

Create successful ePaper yourself
Turn your PDF publications into a flip-book with our unique Google optimized e-Paper software.
38 Management <strong>Report</strong><br />
Key results<br />
Bus<strong>in</strong>ess activities and operat<strong>in</strong>g environment<br />
Net assets, f<strong>in</strong>ancial position and result of operations<br />
DOUGLAS HOLDING AG<br />
Subsequent events<br />
Control system and success factors<br />
Opportunities and risks situation<br />
Statutory disclosures<br />
Forecast and overall assessment<br />
Fig. 5<br />
Adjusted for the costs <strong>in</strong>curred for the store network streaml<strong>in</strong><strong>in</strong>g, the prior year’s figure<br />
stood at 127.6 million EUR. Hence, despite the weak sales <strong>in</strong>crease, like-for-like earn<strong>in</strong>gs<br />
slightly improved. Similar to the preced<strong>in</strong>g year, the return on sales – the ratio of EBT to<br />
sales – came <strong>in</strong> at 4.0 percent.<br />
Follow<strong>in</strong>g the majority acquisition of buch.de, a revaluation of shares already held<br />
was performed <strong>in</strong> conformity with IFRS 3. The one-off <strong>in</strong>come amount of 6.1 million EUR<br />
positively impacted the earn<strong>in</strong>gs for the year under review. This one-off effect however<br />
was offset by additional costs <strong>in</strong>curred, because goodwill impairments for the report<strong>in</strong>g<br />
period were <strong>10</strong>,8 million EUR more than <strong>in</strong> the preced<strong>in</strong>g year.<br />
Consequent implementation of the store network streaml<strong>in</strong><strong>in</strong>g<br />
In the preced<strong>in</strong>g year, the DOUGLAS Group resolved a store network streaml<strong>in</strong><strong>in</strong>g program,<br />
<strong>in</strong> which all stores generat<strong>in</strong>g a negative cash flow with no expectation of a susta<strong>in</strong>able<br />
improvement <strong>in</strong> earn<strong>in</strong>gs on the medium term were to be closed. A decisive factor<br />
was the cash-effect of costs associated with a store closure. As far as the cash costs of a<br />
store closure were estimated to be lower <strong>in</strong> the next one to two years than the anticipated<br />
negative cash flows from cont<strong>in</strong>u<strong>in</strong>g operations, it was decided to close the store. In total,<br />
clos<strong>in</strong>g costs amount<strong>in</strong>g to 23.7 million EUR were recognized <strong>in</strong> the previous year. These<br />
costs related to the divisions Perfumeries (19.2 million EUR), Fashion (3.8 million EUR)<br />
and Confectionery (0.7 million EUR). As of September 30, 20<strong>10</strong> the planned store network<br />
streaml<strong>in</strong><strong>in</strong>g program was largely completed.<br />
Operat<strong>in</strong>g earn<strong>in</strong>gs contribution by the divisions<br />
The Perfumeries’ earn<strong>in</strong>gs before taxes (EBT) reached 87.9 million EUR follow<strong>in</strong>g 87.7<br />
million EUR before clos<strong>in</strong>g costs <strong>in</strong> the same period last year. Correspond<strong>in</strong>gly, the return<br />
on sales (EBT marg<strong>in</strong>) rema<strong>in</strong>ed unchanged at 4.7 percent. While the earn<strong>in</strong>gs contribution<br />
of the domestic perfumeries significantly exceeded the prior year’s level due to the<br />
respectable sales performance, the EBT of the perfumeries outside of Germany decl<strong>in</strong>ed<br />
further. This was caused by the ongo<strong>in</strong>g challeng<strong>in</strong>g macroeconomic conditions <strong>in</strong> several<br />
countries, which led to lower sales and higher goodwill write-downs <strong>in</strong> some foreign<br />
subsidiaries.<br />
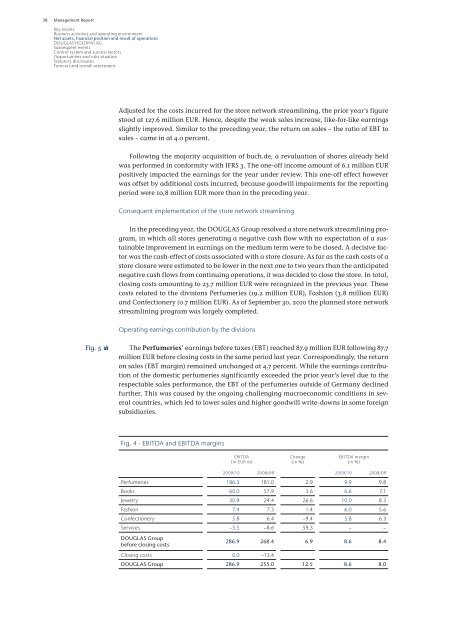
Fig. 4 · EBITDA and EBITDA marg<strong>in</strong>s<br />
EBITDA<br />
(<strong>in</strong> EUR m)<br />
Change<br />
(<strong>in</strong> %)<br />
EBITDA marg<strong>in</strong><br />
(<strong>in</strong> %)<br />
<strong>2009</strong>/<strong>10</strong> 2008/09 <strong>2009</strong>/<strong>10</strong> 2008/09<br />
Perfumeries 186.3 181.0 2.9 9.9 9.8<br />
Books 60.0 57.9 3.6 6.6 7.1<br />
Jewelry 30.9 24.4 26.6 <strong>10</strong>.0 8.3<br />
Fashion 7.4 7.3 1.4 6.0 5.6<br />
Confectionery 5.8 6.4 −9.4 5.8 6.3<br />
Services −3.5 −8.6 59.3 − −<br />
DOUGLAS Group<br />
before clos<strong>in</strong>g costs<br />
286.9 268.4 6.9 8.6 8.4<br />
Clos<strong>in</strong>g costs 0.0 −13.4<br />
DOUGLAS Group 286.9 255.0 12.5 8.6 8.0