Annual Report 2009/10 Excellence in Retailing - Douglas Holding
Annual Report 2009/10 Excellence in Retailing - Douglas Holding
Annual Report 2009/10 Excellence in Retailing - Douglas Holding

Create successful ePaper yourself
Turn your PDF publications into a flip-book with our unique Google optimized e-Paper software.
118 F<strong>in</strong>ancial statements<br />
Facts & figures<br />
Consolidated <strong>in</strong>come statement<br />
Consolidated balance sheet<br />
Statement of changes <strong>in</strong> Group equity<br />
Segment report<strong>in</strong>g<br />
Consolidated Cash Flow statement<br />
Notes<br />
Notes to the <strong>in</strong>come statement<br />
Notes to the balance sheet<br />
Auditor’s report<br />
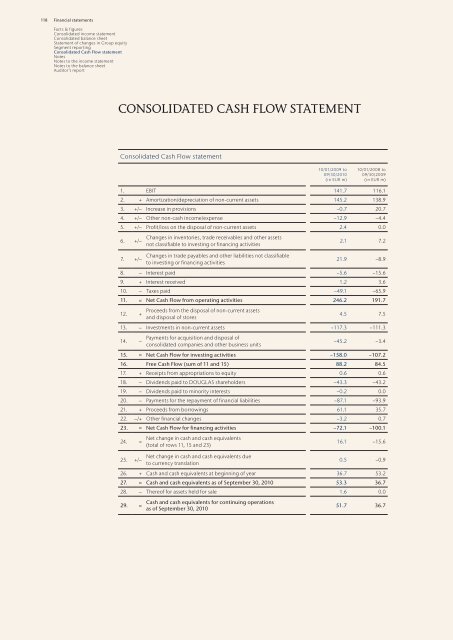
CONSOLIDATED CASH FLOW STATEMENT<br />
Consolidated Cash Flow statement<br />
<strong>10</strong>/01/<strong>2009</strong> to<br />
09/30/20<strong>10</strong><br />
(<strong>in</strong> EUR m)<br />
<strong>10</strong>/01/2008 to<br />
09/30/<strong>2009</strong><br />
(<strong>in</strong> EUR m)<br />
1. EBIT 141.7 116.1<br />
2. + Amortization/depreciation of non-current assets 145.2 138.9<br />
3. +/– Increase <strong>in</strong> provisions −0.7 20.7<br />
4. +/– Other non-cash <strong>in</strong>come/expense −12.9 −4.4<br />
5. +/– Profit/loss on the disposal of non-current assets 2.4 0.0<br />
6. +/–<br />
Changes <strong>in</strong> <strong>in</strong>ventories, trade receivables and other assets<br />
not classifiable to <strong>in</strong>vest<strong>in</strong>g or f<strong>in</strong>anc<strong>in</strong>g activities<br />
2.1 7.2<br />
7. +/–<br />
Changes <strong>in</strong> trade payables and other liabilities not classifiable<br />
to <strong>in</strong>vest<strong>in</strong>g or f<strong>in</strong>anc<strong>in</strong>g activities<br />
21.9 −8.9<br />
8. – Interest paid −5.6 −15.6<br />
9. + Interest received 1.2 3.6<br />
<strong>10</strong>. – Taxes paid −49.1 −65.9<br />
11. = Net Cash Flow from operat<strong>in</strong>g activities 246.2 191.7<br />
12. +<br />
Proceeds from the disposal of non-current assets<br />
and disposal of stores<br />
4.5 7.5<br />
13. – Investments <strong>in</strong> non-current assets −117.3 −111.3<br />
14. –<br />
Payments for acquisition and disposal of<br />
consolidated companies and other bus<strong>in</strong>ess units<br />
−45.2 −3.4<br />
15. = Net Cash Flow for <strong>in</strong>vest<strong>in</strong>g activities −158.0 −<strong>10</strong>7.2<br />
16. Free Cash Flow (sum of 11 and 15) 88.2 84.5<br />
17. + Receipts from appropriations to equity 0.6 0.6<br />
18. – Dividends paid to DOUGLAS shareholders −43.3 −43.2<br />
19. – Dividends paid to m<strong>in</strong>ority <strong>in</strong>terests −0.2 0.0<br />
20. – Payments for the repayment of f<strong>in</strong>ancial liabilities −87.1 −93.9<br />
21. + Proceeds from borrow<strong>in</strong>gs 61.1 35.7<br />
22. –/+ Other f<strong>in</strong>ancial changes −3.2 0.7<br />
23. = Net Cash Flow for f<strong>in</strong>anc<strong>in</strong>g activities −72.1 −<strong>10</strong>0.1<br />
24. =<br />
Net change <strong>in</strong> cash and cash equivalents<br />
(total of rows 11, 15 and 23)<br />
16.1 −15.6<br />
25. +/–<br />
Net change <strong>in</strong> cash and cash equivalents due<br />
to currency translation<br />
0.5 −0.9<br />
26. + Cash and cash equivalents at beg<strong>in</strong>n<strong>in</strong>g of year 36.7 53.2<br />
27. = Cash and cash equivalents as of September 30, 20<strong>10</strong> 53.3 36.7<br />
28. – Thereof for assets held for sale 1.6 0.0<br />
29. =<br />
Cash and cash equivalents for cont<strong>in</strong>u<strong>in</strong>g operations<br />
as of September 30, 20<strong>10</strong><br />
51.7 36.7