rapporto sul turismo montano 2000-2006 e congiuntura 2007
rapporto sul turismo montano 2000-2006 e congiuntura 2007
rapporto sul turismo montano 2000-2006 e congiuntura 2007

Create successful ePaper yourself
Turn your PDF publications into a flip-book with our unique Google optimized e-Paper software.
Tabella 24: Presenze di turisti per provenienza. Stagione estiva. <strong>2000</strong>-<strong>2006</strong><br />
Valori assoluti Var.% Composizione%<br />
Italiani Stranieri Totali Italiani Stranieri Totali Italiani Stranieri Totali<br />
<strong>2000</strong> 183.121 1.554 184.675 99% 1% 100%<br />
2001 183.534 1.607 185.141 0,2 3,4 0,3 99% 1% 100%<br />
2002 176.064 1.713 177.777 -4,1 6,6 -4,0 99% 1% 100%<br />
2003 178.534 1.766 180.300 1,4 3,1 1,4 99% 1% 100%<br />
2004 167.108 2.062 169.170 -6,4 16,8 -6,2 99% 1% 100%<br />
2005 134.960 995 135.955 -19,2 -51,7 -19,6 99% 1% 100%<br />
<strong>2006</strong> 141.415 14.199 155.614 4,8 1327,0 14,5 91% 9% 100%<br />
Fonte: elaborazione CISET su dati Regione Friuli Venezia Giulia<br />
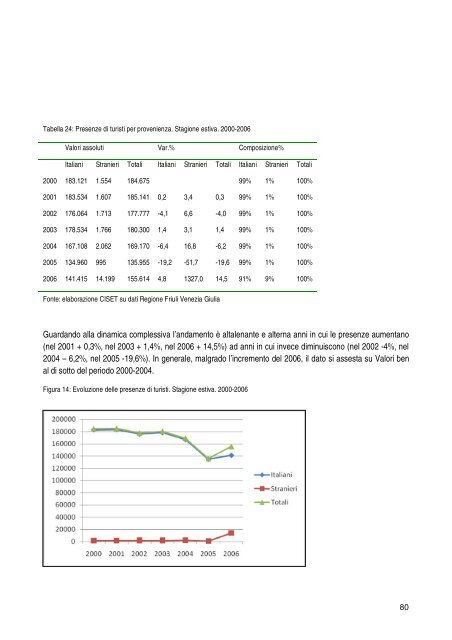
Guardando alla dinamica complessiva l’andamento è altalenante e alterna anni in cui le presenze aumentano<br />
(nel 2001 + 0,3%, nel 2003 + 1,4%, nel <strong>2006</strong> + 14,5%) ad anni in cui invece diminuiscono (nel 2002 -4%, nel<br />
2004 – 6,2%, nel 2005 -19,6%). In generale, malgrado l’incremento del <strong>2006</strong>, il dato si assesta su Valori ben<br />
al di sotto del periodo <strong>2000</strong>-2004.<br />
Figura 14: Evoluzione delle presenze di turisti. Stagione estiva. <strong>2000</strong>-<strong>2006</strong><br />
80