Smithsonian at the Poles: Contributions to International Polar
Smithsonian at the Poles: Contributions to International Polar
Smithsonian at the Poles: Contributions to International Polar

Create successful ePaper yourself
Turn your PDF publications into a flip-book with our unique Google optimized e-Paper software.
200 SMITHSONIAN AT THE POLES / VECCHIONE ET AL.<br />
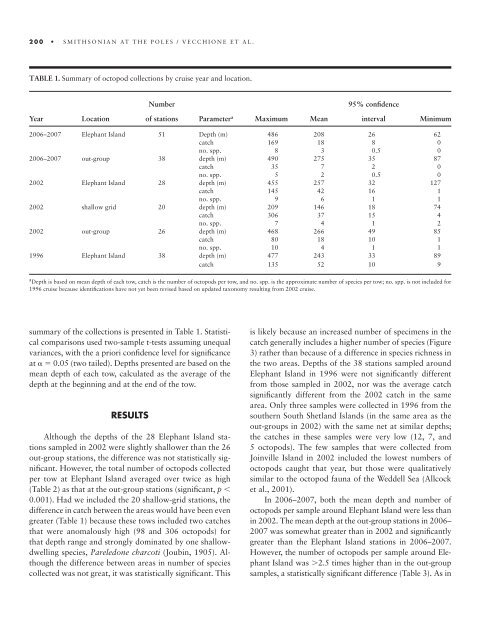
TABLE 1. Summary of oc<strong>to</strong>pod collections by cruise year and loc<strong>at</strong>ion.<br />
summary of <strong>the</strong> collections is presented in Table 1. St<strong>at</strong>istical<br />
comparisons used two-sample t-tests assuming unequal<br />
variances, with <strong>the</strong> a priori confi dence level for signifi cance<br />
<strong>at</strong> � � 0.05 (two tailed). Depths presented are based on <strong>the</strong><br />
mean depth of each <strong>to</strong>w, calcul<strong>at</strong>ed as <strong>the</strong> average of <strong>the</strong><br />
depth <strong>at</strong> <strong>the</strong> beginning and <strong>at</strong> <strong>the</strong> end of <strong>the</strong> <strong>to</strong>w.<br />
RESULTS<br />
Although <strong>the</strong> depths of <strong>the</strong> 28 Elephant Island st<strong>at</strong>ions<br />
sampled in 2002 were slightly shallower than <strong>the</strong> 26<br />
out-group st<strong>at</strong>ions, <strong>the</strong> difference was not st<strong>at</strong>istically signifi<br />
cant. However, <strong>the</strong> <strong>to</strong>tal number of oc<strong>to</strong>pods collected<br />
per <strong>to</strong>w <strong>at</strong> Elephant Island averaged over twice as high<br />
(Table 2) as th<strong>at</strong> <strong>at</strong> <strong>the</strong> out-group st<strong>at</strong>ions (signifi cant, p �<br />
0.001). Had we included <strong>the</strong> 20 shallow-grid st<strong>at</strong>ions, <strong>the</strong><br />
difference in c<strong>at</strong>ch between <strong>the</strong> areas would have been even<br />
gre<strong>at</strong>er (Table 1) because <strong>the</strong>se <strong>to</strong>ws included two c<strong>at</strong>ches<br />
th<strong>at</strong> were anomalously high (98 and 306 oc<strong>to</strong>pods) for<br />
th<strong>at</strong> depth range and strongly domin<strong>at</strong>ed by one shallowdwelling<br />
species, Pareledone charcoti (Joubin, 1905). Although<br />
<strong>the</strong> difference between areas in number of species<br />
collected was not gre<strong>at</strong>, it was st<strong>at</strong>istically signifi cant. This<br />
Number 95% confi dence<br />
Year Loc<strong>at</strong>ion of st<strong>at</strong>ions Parameter a Maximum Mean interval Minimum<br />
2006– 2007 Elephant Island 51 Depth (m) 486 208 26 62<br />
c<strong>at</strong>ch 169 18 8 0<br />
no. spp. 8 3 0.5 0<br />
2006– 2007 out-group 38 depth (m) 490 275 35 87<br />
c<strong>at</strong>ch 35 7 2 0<br />
no. spp. 5 2 0.5 0<br />
2002 Elephant Island 28 depth (m) 455 257 32 127<br />
c<strong>at</strong>ch 145 42 16 1<br />
no. spp. 9 6 1 1<br />
2002 shallow grid 20 depth (m) 209 146 18 74<br />
c<strong>at</strong>ch 306 37 15 4<br />
no. spp. 7 4 1 2<br />
2002 out-group 26 depth (m) 468 266 49 85<br />
c<strong>at</strong>ch 80 18 10 1<br />
no. spp. 10 4 1 1<br />
1996 Elephant Island 38 depth (m) 477 243 33 89<br />
c<strong>at</strong>ch 135 52 10 9<br />
a Depth is based on mean depth of each <strong>to</strong>w, c<strong>at</strong>ch is <strong>the</strong> number of oc<strong>to</strong>pods per <strong>to</strong>w, and no. spp. is <strong>the</strong> approxim<strong>at</strong>e number of species per <strong>to</strong>w; no. spp. is not included for<br />
1996 cruise because identifi c<strong>at</strong>ions have not yet been revised based on upd<strong>at</strong>ed taxonomy resulting from 2002 cruise.<br />
is likely because an increased number of specimens in <strong>the</strong><br />
c<strong>at</strong>ch generally includes a higher number of species (Figure<br />
3) r<strong>at</strong>her than because of a difference in species richness in<br />
<strong>the</strong> two areas. Depths of <strong>the</strong> 38 st<strong>at</strong>ions sampled around<br />
Elephant Island in 1996 were not signifi cantly different<br />
from those sampled in 2002, nor was <strong>the</strong> average c<strong>at</strong>ch<br />
signifi cantly different from <strong>the</strong> 2002 c<strong>at</strong>ch in <strong>the</strong> same<br />
area. Only three samples were collected in 1996 from <strong>the</strong><br />
sou<strong>the</strong>rn South Shetland Islands (in <strong>the</strong> same area as <strong>the</strong><br />
out-groups in 2002) with <strong>the</strong> same net <strong>at</strong> similar depths;<br />
<strong>the</strong> c<strong>at</strong>ches in <strong>the</strong>se samples were very low (12, 7, and<br />
5 oc<strong>to</strong>pods). The few samples th<strong>at</strong> were collected from<br />
Joinville Island in 2002 included <strong>the</strong> lowest numbers of<br />
oc<strong>to</strong>pods caught th<strong>at</strong> year, but those were qualit<strong>at</strong>ively<br />
similar <strong>to</strong> <strong>the</strong> oc<strong>to</strong>pod fauna of <strong>the</strong> Weddell Sea (Allcock<br />
et al., 2001).<br />
In 2006– 2007, both <strong>the</strong> mean depth and number of<br />
oc<strong>to</strong>pods per sample around Elephant Island were less than<br />
in 2002. The mean depth <strong>at</strong> <strong>the</strong> out-group st<strong>at</strong>ions in 2006–<br />
2007 was somewh<strong>at</strong> gre<strong>at</strong>er than in 2002 and signifi cantly<br />
gre<strong>at</strong>er than <strong>the</strong> Elephant Island st<strong>at</strong>ions in 2006– 2007.<br />
However, <strong>the</strong> number of oc<strong>to</strong>pods per sample around Elephant<br />
Island was �2.5 times higher than in <strong>the</strong> out-group<br />
samples, a st<strong>at</strong>istically signifi cant difference (Table 3). As in