Smithsonian at the Poles: Contributions to International Polar
Smithsonian at the Poles: Contributions to International Polar
Smithsonian at the Poles: Contributions to International Polar

Create successful ePaper yourself
Turn your PDF publications into a flip-book with our unique Google optimized e-Paper software.
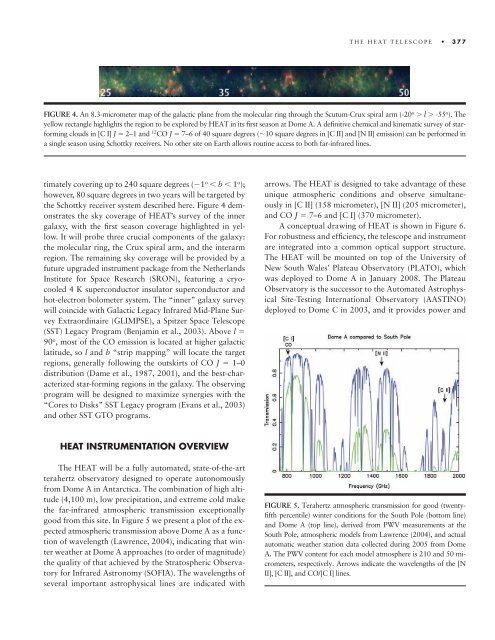
tim<strong>at</strong>ely covering up <strong>to</strong> 240 square degrees (�1 o � b � 1 o );<br />
however, 80 square degrees in two years will be targeted by<br />
<strong>the</strong> Schottky receiver system described here. Figure 4 demonstr<strong>at</strong>es<br />
<strong>the</strong> sky coverage of HEAT’s survey of <strong>the</strong> inner<br />
galaxy, with <strong>the</strong> fi rst season coverage highlighted in yellow.<br />
It will probe three crucial components of <strong>the</strong> galaxy:<br />
<strong>the</strong> molecular ring, <strong>the</strong> Crux spiral arm, and <strong>the</strong> interarm<br />
region. The remaining sky coverage will be provided by a<br />
future upgraded instrument package from <strong>the</strong> Ne<strong>the</strong>rlands<br />
Institute for Space Research (SRON), fe<strong>at</strong>uring a cryocooled<br />
4 K superconduc<strong>to</strong>r insul<strong>at</strong>or superconduc<strong>to</strong>r and<br />
hot-electron bolometer system. The “inner” galaxy survey<br />
will coincide with Galactic Legacy Infrared Mid-Plane Survey<br />
Extraordinaire (GLIMPSE), a Spitzer Space Telescope<br />
(SST) Legacy Program (Benjamin et al., 2003). Above l �<br />
90 o , most of <strong>the</strong> CO emission is loc<strong>at</strong>ed <strong>at</strong> higher galactic<br />
l<strong>at</strong>itude, so l and b “strip mapping” will loc<strong>at</strong>e <strong>the</strong> target<br />
regions, generally following <strong>the</strong> outskirts of CO J � 1– 0<br />
distribution (Dame et al., 1987, 2001), and <strong>the</strong> best-characterized<br />
star-forming regions in <strong>the</strong> galaxy. The observing<br />
program will be designed <strong>to</strong> maximize synergies with <strong>the</strong><br />
“Cores <strong>to</strong> Disks” SST Legacy program (Evans et al., 2003)<br />
and o<strong>the</strong>r SST GTO programs.<br />
HEAT INSTRUMENTATION OVERVIEW<br />
The HEAT will be a fully au<strong>to</strong>m<strong>at</strong>ed, st<strong>at</strong>e-of-<strong>the</strong>-art<br />
terahertz observ<strong>at</strong>ory designed <strong>to</strong> oper<strong>at</strong>e au<strong>to</strong>nomously<br />
from Dome A in Antarctica. The combin<strong>at</strong>ion of high altitude<br />
(4,100 m), low precipit<strong>at</strong>ion, and extreme cold make<br />
<strong>the</strong> far-infrared <strong>at</strong>mospheric transmission exceptionally<br />
good from this site. In Figure 5 we present a plot of <strong>the</strong> expected<br />
<strong>at</strong>mospheric transmission above Dome A as a function<br />
of wavelength (Lawrence, 2004), indic<strong>at</strong>ing th<strong>at</strong> winter<br />
we<strong>at</strong>her <strong>at</strong> Dome A approaches (<strong>to</strong> order of magnitude)<br />
<strong>the</strong> quality of th<strong>at</strong> achieved by <strong>the</strong> Str<strong>at</strong>ospheric Observ<strong>at</strong>ory<br />
for Infrared Astronomy (SOFIA). The wavelengths of<br />
several important astrophysical lines are indic<strong>at</strong>ed with<br />
THE HEAT TELESCOPE 377<br />
FIGURE 4. An 8.3-micrometer map of <strong>the</strong> galactic plane from <strong>the</strong> molecular ring through <strong>the</strong> Scutum-Crux spiral arm (-20 o � l � -55 o ). The<br />
yellow rectangle highlights <strong>the</strong> region <strong>to</strong> be explored by HEAT in its fi rst season <strong>at</strong> Dome A. A defi nitive chemical and kinem<strong>at</strong>ic survey of starforming<br />
clouds in [C I] J � 2– 1 and 12 CO J � 7– 6 of 40 square degrees (�10 square degrees in [C II] and [N II] emission) can be performed in<br />
a single season using Schottky receivers. No o<strong>the</strong>r site on Earth allows routine access <strong>to</strong> both far-infrared lines.<br />
arrows. The HEAT is designed <strong>to</strong> take advantage of <strong>the</strong>se<br />
unique <strong>at</strong>mospheric conditions and observe simultaneously<br />
in [C II] (158 micrometer), [N II] (205 micro meter),<br />
and CO J � 7– 6 and [C I] (370 micrometer).<br />
A conceptual drawing of HEAT is shown in Figure 6.<br />
For robustness and effi ciency, <strong>the</strong> telescope and instrument<br />
are integr<strong>at</strong>ed in<strong>to</strong> a common optical support structure.<br />
The HEAT will be mounted on <strong>to</strong>p of <strong>the</strong> University of<br />
New South Wales’ Pl<strong>at</strong>eau Observ<strong>at</strong>ory (PLATO), which<br />
was deployed <strong>to</strong> Dome A in January 2008. The Pl<strong>at</strong>eau<br />
Observ<strong>at</strong>ory is <strong>the</strong> successor <strong>to</strong> <strong>the</strong> Au<strong>to</strong>m<strong>at</strong>ed Astrophysical<br />
Site-Testing Intern<strong>at</strong>ional Observ<strong>at</strong>ory (AASTINO)<br />
deployed <strong>to</strong> Dome C in 2003, and it provides power and<br />
FIGURE 5. Terahertz <strong>at</strong>mospheric transmission for good (twentyfi<br />
fth percentile) winter conditions for <strong>the</strong> South Pole (bot<strong>to</strong>m line)<br />
and Dome A (<strong>to</strong>p line), derived from PWV measurements <strong>at</strong> <strong>the</strong><br />
South Pole, <strong>at</strong>mospheric models from Lawrence (2004), and actual<br />
au<strong>to</strong>m<strong>at</strong>ic we<strong>at</strong>her st<strong>at</strong>ion d<strong>at</strong>a collected during 2005 from Dome<br />
A. The PWV content for each model <strong>at</strong>mosphere is 210 and 50 micrometers,<br />
respectively. Arrows indic<strong>at</strong>e <strong>the</strong> wavelengths of <strong>the</strong> [N<br />
II], [C II], and CO/[C I] lines.