Smithsonian at the Poles: Contributions to International Polar
Smithsonian at the Poles: Contributions to International Polar
Smithsonian at the Poles: Contributions to International Polar
Create successful ePaper yourself
Turn your PDF publications into a flip-book with our unique Google optimized e-Paper software.
292 SMITHSONIAN AT THE POLES / QUETIN AND ROSS<br />
fl oes made for effi cient sampling and better linkage between<br />
d<strong>at</strong>a sets.<br />
During ice camps on two winter cruises for Sou<strong>the</strong>rn<br />
Ocean GLOBEC west of <strong>the</strong> Antarctic peninsula in<br />
2001 and 2002 (methods and results described in Quetin<br />
et al., 2007), <strong>to</strong>tal integr<strong>at</strong>ed chlorophyll a in multiple ice<br />
cores (Fritsen et al., 2008) was measured on <strong>the</strong> same ice<br />
fl oes where larval krill were collected by scuba divers. The<br />
amount of chlorophyll a in <strong>the</strong> ice cores was used as a<br />
proxy for <strong>the</strong> SIMCOs available as food <strong>to</strong> <strong>the</strong> larval krill<br />
living on <strong>the</strong> underside of <strong>the</strong> pack ice. Some of <strong>the</strong> larval<br />
krill were used immedi<strong>at</strong>ely for an index of feeding (pigment<br />
content) (as described in Ross et al., 2004), while<br />
o<strong>the</strong>rs were used in instantaneous growth r<strong>at</strong>e experiments<br />
(in situ growth r<strong>at</strong>e estim<strong>at</strong>es as described in Ross<br />
and Quetin, 1991; Quetin et al., 2003; Ross et al., 2004).<br />
Growth of larval krill in <strong>the</strong>ir winter habit<strong>at</strong> refl ects <strong>the</strong>ir<br />
feeding his<strong>to</strong>ry over <strong>the</strong> past three weeks <strong>to</strong> one month,<br />
and may be an indic<strong>at</strong>or of <strong>the</strong>ir ability <strong>to</strong> survive, th<strong>at</strong><br />
is, better growth indic<strong>at</strong>es higher survivorship than lower<br />
growth. Evidence for similar linkages has been found<br />
for larval fi sh; larvae in better condition will have lower<br />
mortality r<strong>at</strong>es and hence lead <strong>to</strong> stronger year classes, all<br />
else being equal (Pepin, 1991; Ottersen and Loeng, 2000;<br />
Takahashi and W<strong>at</strong>anabe, 2004).<br />
CONTRAST TWO YEARS<br />
The contrast in <strong>the</strong> results for <strong>to</strong>tal integr<strong>at</strong>ed chlorophyll<br />
a in ice cores, pigment content in larval krill, and<br />
<strong>the</strong> in situ growth r<strong>at</strong>es of larvae for 2001 and 2002 was<br />
marked (Table 2) (fi g. 5 in Quetin et al., 2007). Generally,<br />
in 2002 <strong>the</strong> ice cores contained an order of magnitude<br />
more chlorophyll a than in 2001 (Fritsen et al., 2008),<br />
leading us <strong>to</strong> suggest th<strong>at</strong> more food was available <strong>to</strong> larval<br />
krill in 2002 than 2001. The median pigment content<br />
and in situ growth r<strong>at</strong>es were also higher in larval krill<br />
in 2002 than in 2001. In both years, <strong>the</strong> distribution of<br />
pigment content was skewed <strong>to</strong> <strong>the</strong> left, but in 2002 more<br />
than 70% of <strong>the</strong> samples showed higher pigment content<br />
than those of larval krill collected from under <strong>the</strong> ice in<br />
2001. A similar difference in distribution occurred for <strong>the</strong><br />
in situ growth r<strong>at</strong>es (Table 2). In 2002, more than 60%<br />
of <strong>the</strong> growth increments were positive, whereas in 2001<br />
only 13% were positive.<br />
The hypo<strong>the</strong>sis th<strong>at</strong> high concentr<strong>at</strong>ions of ice algae<br />
lead <strong>to</strong> higher growth r<strong>at</strong>es is supported by a comparison<br />
of <strong>the</strong> in situ growth r<strong>at</strong>es in <strong>the</strong> larvae and an index of<br />
feeding for larvae collected from <strong>the</strong> same place and <strong>at</strong><br />
<strong>the</strong> same time. For this comparison, in situ growth r<strong>at</strong>es<br />
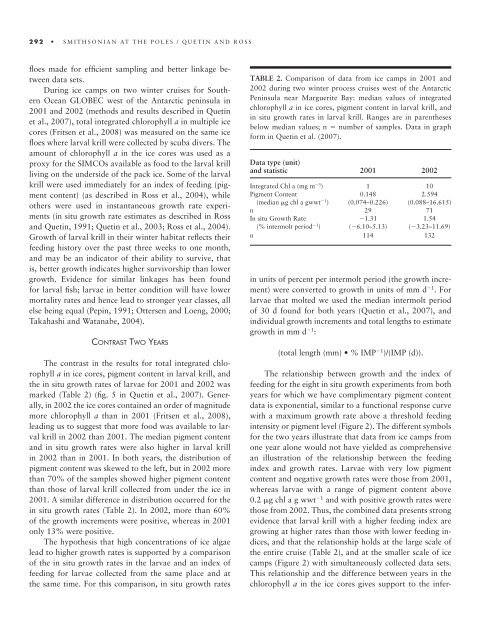
TABLE 2. Comparison of d<strong>at</strong>a from ice camps in 2001 and<br />
2002 during two winter process cruises west of <strong>the</strong> Antarctic<br />
Peninsula near Marguerite Bay: median values of integr<strong>at</strong>ed<br />
chlorophyll a in ice cores, pigment content in larval krill, and<br />
in situ growth r<strong>at</strong>es in larval krill. Ranges are in paren<strong>the</strong>ses<br />
below median values; n � number of samples. D<strong>at</strong>a in graph<br />
form in Quetin et al. (2007).<br />
D<strong>at</strong>a type (unit)<br />
and st<strong>at</strong>istic 2001 2002<br />
Integr<strong>at</strong>ed Chl a (mg m �3 ) 1 10<br />
Pigment Content 0.148 2.594<br />
(median �g chl a gwwt �1 ) (0.074– 0.226) (0.088– 16.615)<br />
n 29 71<br />
In situ Growth R<strong>at</strong>e �1.31 1.54<br />
(% intermolt period �1 ) (�6.10– 5.13) (�3.23– 11.69)<br />
n 114 132<br />
in units of percent per intermolt period (<strong>the</strong> growth increment)<br />
were converted <strong>to</strong> growth in units of mm d �1 . For<br />
larvae th<strong>at</strong> molted we used <strong>the</strong> median intermolt period<br />
of 30 d found for both years (Quetin et al., 2007), and<br />
individual growth increments and <strong>to</strong>tal lengths <strong>to</strong> estim<strong>at</strong>e<br />
growth in mm d �1 :<br />
(<strong>to</strong>tal length (mm) • % IMP �1 )/(IMP (d)).<br />
The rel<strong>at</strong>ionship between growth and <strong>the</strong> index of<br />
feeding for <strong>the</strong> eight in situ growth experiments from both<br />
years for which we have complimentary pigment content<br />
d<strong>at</strong>a is exponential, similar <strong>to</strong> a functional response curve<br />
with a maximum growth r<strong>at</strong>e above a threshold feeding<br />
intensity or pigment level (Figure 2). The different symbols<br />
for <strong>the</strong> two years illustr<strong>at</strong>e th<strong>at</strong> d<strong>at</strong>a from ice camps from<br />
one year alone would not have yielded as comprehensive<br />
an illustr<strong>at</strong>ion of <strong>the</strong> rel<strong>at</strong>ionship between <strong>the</strong> feeding<br />
index and growth r<strong>at</strong>es. Larvae with very low pigment<br />
content and neg<strong>at</strong>ive growth r<strong>at</strong>es were those from 2001,<br />
whereas larvae with a range of pigment content above<br />
0.2 �g chl a g wwt �1 and with positive growth r<strong>at</strong>es were<br />
those from 2002. Thus, <strong>the</strong> combined d<strong>at</strong>a presents strong<br />
evidence th<strong>at</strong> larval krill with a higher feeding index are<br />
growing <strong>at</strong> higher r<strong>at</strong>es than those with lower feeding indices,<br />
and th<strong>at</strong> <strong>the</strong> rel<strong>at</strong>ionship holds <strong>at</strong> <strong>the</strong> large scale of<br />
<strong>the</strong> entire cruise (Table 2), and <strong>at</strong> <strong>the</strong> smaller scale of ice<br />
camps (Figure 2) with simultaneously collected d<strong>at</strong>a sets.<br />
This rel<strong>at</strong>ionship and <strong>the</strong> difference between years in <strong>the</strong><br />
chlorophyll a in <strong>the</strong> ice cores gives support <strong>to</strong> <strong>the</strong> infer-


