Smithsonian at the Poles: Contributions to International Polar
Smithsonian at the Poles: Contributions to International Polar
Smithsonian at the Poles: Contributions to International Polar

Create successful ePaper yourself
Turn your PDF publications into a flip-book with our unique Google optimized e-Paper software.
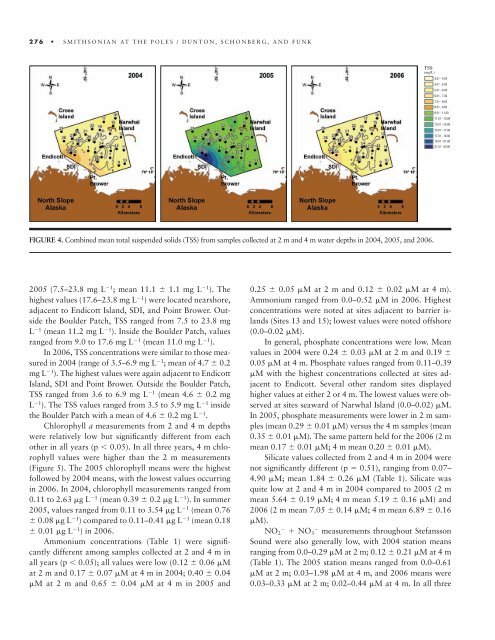
276 SMITHSONIAN AT THE POLES / DUNTON, SCHONBERG, AND FUNK<br />
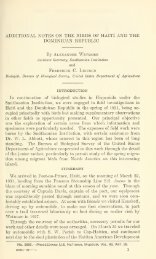
FIGURE 4. Combined mean <strong>to</strong>tal suspended solids (TSS) from samples collected <strong>at</strong> 2 m and 4 m w<strong>at</strong>er depths in 2004, 2005, and 2006.<br />
2005 (7.5– 23.8 mg L �1 ; mean 11.1 � 1.1 mg L �1 ). The<br />
highest values (17.6– 23.8 mg L �1 ) were loc<strong>at</strong>ed nearshore,<br />
adjacent <strong>to</strong> Endicott Island, SDI, and Point Brower. Outside<br />
<strong>the</strong> Boulder P<strong>at</strong>ch, TSS ranged from 7.5 <strong>to</strong> 23.8 mg<br />
L �1 (mean 11.2 mg L �1 ). Inside <strong>the</strong> Boulder P<strong>at</strong>ch, values<br />
ranged from 9.0 <strong>to</strong> 17.6 mg L �1 (mean 11.0 mg L �1 ).<br />
In 2006, TSS concentr<strong>at</strong>ions were similar <strong>to</strong> those measured<br />
in 2004 (range of 3.5– 6.9 mg L �1 ; mean of 4.7 � 0.2<br />
mg L �1 ). The highest values were again adjacent <strong>to</strong> Endicott<br />
Island, SDI and Point Brower. Outside <strong>the</strong> Boulder P<strong>at</strong>ch,<br />
TSS ranged from 3.6 <strong>to</strong> 6.9 mg L �1 (mean 4.6 � 0.2 mg<br />
L �1 ). The TSS values ranged from 3.5 <strong>to</strong> 5.9 mg L �1 inside<br />
<strong>the</strong> Boulder P<strong>at</strong>ch with a mean of 4.6 � 0.2 mg L �1 .<br />
Chlorophyll a measurements from 2 and 4 m depths<br />
were rel<strong>at</strong>ively low but signifi cantly different from each<br />
o<strong>the</strong>r in all years (p � 0.05). In all three years, 4 m chlorophyll<br />
values were higher than <strong>the</strong> 2 m measurements<br />
(Figure 5). The 2005 chlorophyll means were <strong>the</strong> highest<br />
followed by 2004 means, with <strong>the</strong> lowest values occurring<br />
in 2006. In 2004, chlorophyll measurements ranged from<br />
0.11 <strong>to</strong> 2.63 �g L �1 (mean 0.39 � 0.2 �g L �1 ). In summer<br />
2005, values ranged from 0.11 <strong>to</strong> 3.54 �g L �1 (mean 0.76<br />
� 0.08 �g L �1 ) compared <strong>to</strong> 0.11– 0.41 �g L �1 (mean 0.18<br />
� 0.01 �g L �1 ) in 2006.<br />
Ammonium concentr<strong>at</strong>ions (Table 1) were signifi -<br />
cantly different among samples collected <strong>at</strong> 2 and 4 m in<br />
all years (p � 0.05); all values were low (0.12 � 0.06 �M<br />
<strong>at</strong> 2 m and 0.17 � 0.07 �M <strong>at</strong> 4 m in 2004; 0.40 � 0.04<br />
�M <strong>at</strong> 2 m and 0.65 � 0.04 �M <strong>at</strong> 4 m in 2005 and<br />
TSS<br />
(mg/L)<br />
3.01 - 4.00<br />
4.01 - 5.00<br />
5.01 - 6.00<br />
6.01 - 7.00<br />
7.01 - 8.00<br />
8.01 - 9.00<br />
9.01 - 11.00<br />
11.01 - 13.00<br />
13.01 - 15.00<br />
15.01 - 17.00<br />
17.01 - 19.00<br />
19.01 - 21.00<br />
21.01 - 23.00<br />
0.25 � 0.05 �M <strong>at</strong> 2 m and 0.12 � 0.02 �M <strong>at</strong> 4 m).<br />
Ammonium ranged from 0.0– 0.52 �M in 2006. Highest<br />
concentr<strong>at</strong>ions were noted <strong>at</strong> sites adjacent <strong>to</strong> barrier islands<br />
(Sites 13 and 15); lowest values were noted offshore<br />
(0.0– 0.02 �M).<br />
In general, phosph<strong>at</strong>e concentr<strong>at</strong>ions were low. Mean<br />
values in 2004 were 0.24 � 0.03 �M <strong>at</strong> 2 m and 0.19 �<br />
0.05 �M <strong>at</strong> 4 m. Phosph<strong>at</strong>e values ranged from 0.11– 0.39<br />
�M with <strong>the</strong> highest concentr<strong>at</strong>ions collected <strong>at</strong> sites adjacent<br />
<strong>to</strong> Endicott. Several o<strong>the</strong>r random sites displayed<br />
higher values <strong>at</strong> ei<strong>the</strong>r 2 or 4 m. The lowest values were observed<br />
<strong>at</strong> sites seaward of Narwhal Island (0.0– 0.02) �M.<br />
In 2005, phosph<strong>at</strong>e measurements were lower in 2 m samples<br />
(mean 0.29 � 0.01 �M) versus <strong>the</strong> 4 m samples (mean<br />
0.35 � 0.01 �M). The same p<strong>at</strong>tern held for <strong>the</strong> 2006 (2 m<br />
mean 0.17 � 0.01 �M; 4 m mean 0.20 � 0.01 �M).<br />
Silic<strong>at</strong>e values collected from 2 and 4 m in 2004 were<br />
not signifi cantly different (p � 0.51), ranging from 0.07–<br />
4.90 �M; mean 1.84 � 0.26 �M (Table 1). Silic<strong>at</strong>e was<br />
quite low <strong>at</strong> 2 and 4 m in 2004 compared <strong>to</strong> 2005 (2 m<br />
mean 5.64 � 0.19 �M; 4 m mean 5.19 � 0.16 �M) and<br />
2006 (2 m mean 7.05 � 0.14 �M; 4 m mean 6.89 � 0.16<br />
�M).<br />
NO2 � � NO3 � measurements throughout Stefansson<br />
Sound were also generally low, with 2004 st<strong>at</strong>ion means<br />
ranging from 0.0– 0.29 �M <strong>at</strong> 2 m; 0.12 � 0.21 �M <strong>at</strong> 4 m<br />
(Table 1). The 2005 st<strong>at</strong>ion means ranged from 0.0– 0.61<br />
�M <strong>at</strong> 2 m; 0.03– 1.98 �M <strong>at</strong> 4 m, and 2006 means were<br />
0.03– 0.33 �M <strong>at</strong> 2 m; 0.02– 0.44 �M <strong>at</strong> 4 m. In all three