Smithsonian at the Poles: Contributions to International Polar
Smithsonian at the Poles: Contributions to International Polar
Smithsonian at the Poles: Contributions to International Polar

Create successful ePaper yourself
Turn your PDF publications into a flip-book with our unique Google optimized e-Paper software.
326 SMITHSONIAN AT THE POLES / KIEBER, TOOLE, AND KIENE<br />
absorption coeffi cients or spectral slopes (S350–400) <strong>at</strong> wavelengths<br />
gre<strong>at</strong>er than approxim<strong>at</strong>ely 350 nm. At shorter<br />
wavelengths, absorption coeffi cients and spectral slopes<br />
(S275–295) varied by 15%– 30%, but with no consistent p<strong>at</strong>tern<br />
among <strong>the</strong> many samples analyzed during a period<br />
when Kd(340 and 443) and chl a changed by more than a<br />
fac<strong>to</strong>r of 6 and 100, respectively.<br />
Although <strong>the</strong>re were generally only small changes in<br />
aλ spectra and S, <strong>the</strong>re was an indic<strong>at</strong>ion of a discernable<br />
increase in absorption coeffi cients in <strong>the</strong> vicinity of 330–<br />
350 nm seen in a few sample spectra (st<strong>at</strong>ion R14), with<br />
<strong>the</strong> presence of a small peak (or shoulder) noted in some<br />
cases. Previous results in <strong>the</strong> liter<strong>at</strong>ure suggest th<strong>at</strong> this<br />
peak may be due <strong>to</strong> <strong>the</strong> presence of MAA in <strong>the</strong> dissolved<br />
phase, possibly stemming from release by Phaeocystis antarctica,<br />
ei<strong>the</strong>r through grazing, viral lysis, or direct release.<br />
The MAA are one of <strong>the</strong> primary UV-absorbing compounds<br />
detected in Phaeocystis antarctica (e.g., Riegger<br />
and Robinson, 1997; Moisan and Mitchell, 2001), and<br />
it would not be unreasonable for <strong>the</strong>re <strong>to</strong> be some algal<br />
release of MAA in<strong>to</strong> <strong>the</strong> dissolved phase. However, it is<br />
also possible th<strong>at</strong> this UV absorption peak was an artifact<br />
of sample fi ltr<strong>at</strong>ion (cf. Laurion et al., 2003). While artifacts<br />
associ<strong>at</strong>ed with sample fi ltr<strong>at</strong>ion were not rigorously<br />
tested in this study, <strong>the</strong>y are probably minimal because<br />
we prescreened w<strong>at</strong>er by gravity through 20-�m Nitex<br />
mesh <strong>to</strong> remove large aggreg<strong>at</strong>es and Phaeocystis colonies<br />
and <strong>the</strong>n used gravity (hydrost<strong>at</strong>ic) pressure for fi ltr<strong>at</strong>ion<br />
through a 0.2-�m AS 75 POLYCAP fi lter. When gentle<br />
vacuum fi ltr<strong>at</strong>ion was tested on samples collected during<br />
<strong>the</strong> bloom, we often observed a 330- <strong>to</strong> 350-nm peak th<strong>at</strong><br />
was not seen in CDOM spectra of <strong>the</strong> same samples th<strong>at</strong><br />
were prescreened and gravity fi ltered. Vacuum fi ltr<strong>at</strong>ion is<br />
not recommended and may explain <strong>the</strong> presence of a peak<br />
in spectra for some samples th<strong>at</strong> were analyzed during a<br />
bloom in Marguerite Bay along <strong>the</strong> Antarctic Peninsula<br />
(P<strong>at</strong>terson, 2000).<br />
The striking lack of change in CDOM spectra and<br />
spectral slopes during <strong>the</strong> development of <strong>the</strong> Phaeocystis<br />
antarctica bloom was also seen in temporal trends<br />
in surface aλ. Using 340 nm as an example, surface values<br />
of a340 in <strong>the</strong> upper 10 m did not appreciably change<br />
from 8 November (0.0782 m �1 ) <strong>to</strong> 29 November (0.0837<br />
m �1 ), while over <strong>the</strong> same time frame, chl a changed by<br />
more than a fac<strong>to</strong>r of 100 from 0.084 <strong>to</strong> 8.45 �g L �1<br />
(Figure 7A). As with 340 nm, no signifi cant changes in<br />
aλ were observed <strong>at</strong> o<strong>the</strong>r wavelengths during <strong>the</strong> development<br />
of <strong>the</strong> bloom. Even though CDOM absorption<br />
coeffi cients did not change over time, downwelling <strong>at</strong>tenu<strong>at</strong>ion<br />
coeffi cients increased dram<strong>at</strong>ically (Figure 7B),<br />
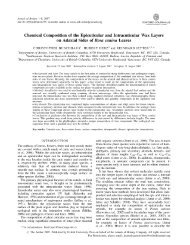
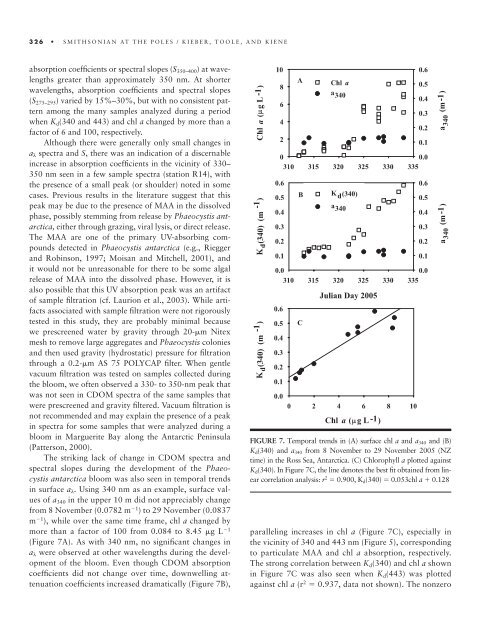
FIGURE 7. Temporal trends in (A) surface chl a and a340 and (B)<br />
Kd(340) and a340 from 8 November <strong>to</strong> 29 November 2005 (NZ<br />
time) in <strong>the</strong> Ross Sea, Antarctica. (C) Chlorophyll a plotted against<br />
Kd(340). In Figure 7C, <strong>the</strong> line denotes <strong>the</strong> best fi t obtained from linear<br />
correl<strong>at</strong>ion analysis: r 2 � 0.900, Kd(340) � 0.053chl a � 0.128<br />
paralleling increases in chl a (Figure 7C), especially in<br />
<strong>the</strong> vicinity of 340 and 443 nm (Figure 5), corresponding<br />
<strong>to</strong> particul<strong>at</strong>e MAA and chl a absorption, respectively.<br />
The strong correl<strong>at</strong>ion between Kd(340) and chl a shown<br />
in Figure 7C was also seen when Kd(443) was plotted<br />
against chl a (r 2 � 0.937, d<strong>at</strong>a not shown). The nonzero