Smithsonian at the Poles: Contributions to International Polar
Smithsonian at the Poles: Contributions to International Polar
Smithsonian at the Poles: Contributions to International Polar

Create successful ePaper yourself
Turn your PDF publications into a flip-book with our unique Google optimized e-Paper software.
concentr<strong>at</strong>ions are lower and <strong>the</strong> w<strong>at</strong>er column is more<br />
deeply mixed. As is typical of polar regions, <strong>the</strong> massive<br />
phy<strong>to</strong>plank<strong>to</strong>n production th<strong>at</strong> is observed during <strong>the</strong> early<br />
stages of this bloom (in <strong>the</strong> early <strong>to</strong> mid austral spring) is<br />
not accompanied by signifi cant micro- or macrozooplank<strong>to</strong>n<br />
grazing (Caron et al., 2000). The spring bloom also<br />
appears <strong>to</strong> be a period of low bacterial abundance and activity<br />
(Ducklow et al., 2001), although bacteria do bloom<br />
during <strong>the</strong> l<strong>at</strong>er stages of <strong>the</strong> algal bloom, in early <strong>to</strong> mid<br />
summer, coinciding with an increase in dissolved and particul<strong>at</strong>e<br />
organic carbon (Carlson et al., 2000).<br />
Depending on physiological and hydrodynamic fac<strong>to</strong>rs,<br />
this ecological decoupling between primary productivity<br />
and both microbial productivity and grazing may<br />
cause <strong>the</strong> phy<strong>to</strong>plank<strong>to</strong>n <strong>to</strong> sink out of <strong>the</strong> photic zone<br />
(DiTullio et al., 2000; Becquevort and Smith, 2001; Overland<br />
and Stabeno, 2004). This may lead <strong>to</strong> a signifi cant<br />
fl ux of organic m<strong>at</strong>ter <strong>to</strong> <strong>the</strong> ocean fl oor and <strong>to</strong> deepw<strong>at</strong>er<br />
CDOM production. Export of <strong>the</strong> phy<strong>to</strong>plank<strong>to</strong>n out of<br />
<strong>the</strong> photic zone may also lead <strong>to</strong> a decoupling of bloom<br />
dynamics and CDOM cycling.<br />
Here we report on sp<strong>at</strong>ial and temporal p<strong>at</strong>terns in<br />
CDOM spectra observed during <strong>the</strong> early stages of <strong>the</strong> 2005<br />
austral spring Phaeocystis antarctica bloom in <strong>the</strong> seasonal<br />
Ross Sea polynya. Our results show th<strong>at</strong> CDOM changed<br />
very little during a period when chl a concentr<strong>at</strong>ions increased<br />
more than one-hundred-fold. Implic<strong>at</strong>ions of this<br />
fi nding for CDOM cycling in <strong>the</strong> Ross Sea are discussed.<br />
METHODS<br />
ROSS SEA SITE DESCRIPTION AND SAMPLING<br />
A fi eld campaign was conducted aboard <strong>the</strong> R/V<br />
N<strong>at</strong>haniel B. Palmer in <strong>the</strong> seasonal ice-free polynya in <strong>the</strong><br />
Ross Sea, Antarctica, from 8 November <strong>to</strong> 30 November<br />
2005 (Figure 1). During this time, <strong>the</strong> surface seaw<strong>at</strong>er temper<strong>at</strong>ure<br />
was approxim<strong>at</strong>ely – 1.8°C and <strong>the</strong> phy<strong>to</strong>plank<strong>to</strong>n<br />
assemblage was domin<strong>at</strong>ed by colonial Phaeocystis<br />
antarctica. Three main hydrographic st<strong>at</strong>ions were occupied<br />
within <strong>the</strong> Ross Sea polynya for approxim<strong>at</strong>ely seven<br />
days each (i.e., R10, R13, R14). Seaw<strong>at</strong>er samples were<br />
collected from early morning hydrocasts (0400-0700 local<br />
time) directly from Niskin bottles <strong>at</strong>tached <strong>to</strong> a conductivity,<br />
temper<strong>at</strong>ure, and depth (CTD) rosette. Vertical profi les<br />
of a suite of routine measurements were obtained <strong>at</strong> each<br />
st<strong>at</strong>ion including downwelling irradiance (and coupled incident<br />
surface irradiance), chl a, and CDOM absorption<br />
spectra. Additionally, a profi le of dissolved organic carbon<br />
(DOC) was collected <strong>at</strong> one st<strong>at</strong>ion (14F).<br />
CHROMOPHORIC DISSOLVED ORGANIC MATTER CYCLING 321<br />
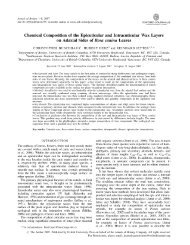
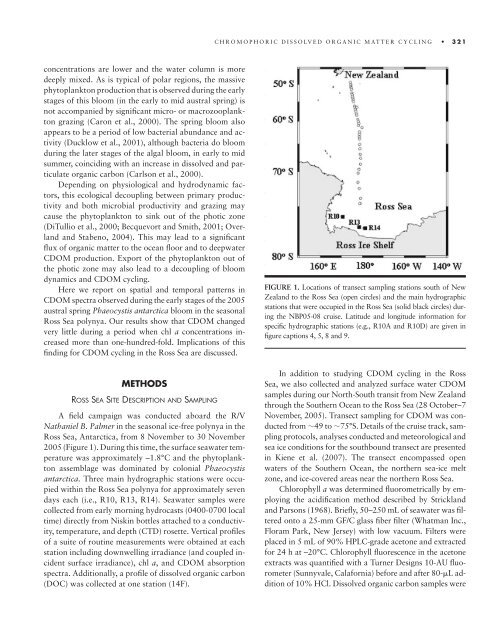
FIGURE 1. Loc<strong>at</strong>ions of transect sampling st<strong>at</strong>ions south of New<br />
Zealand <strong>to</strong> <strong>the</strong> Ross Sea (open circles) and <strong>the</strong> main hydrographic<br />
st<strong>at</strong>ions th<strong>at</strong> were occupied in <strong>the</strong> Ross Sea (solid black circles) during<br />
<strong>the</strong> NBP05-08 cruise. L<strong>at</strong>itude and longitude inform<strong>at</strong>ion for<br />
specifi c hydrographic st<strong>at</strong>ions (e.g., R10A and R10D) are given in<br />
fi gure captions 4, 5, 8 and 9.<br />
In addition <strong>to</strong> studying CDOM cycling in <strong>the</strong> Ross<br />
Sea, we also collected and analyzed surface w<strong>at</strong>er CDOM<br />
samples during our North-South transit from New Zealand<br />
through <strong>the</strong> Sou<strong>the</strong>rn Ocean <strong>to</strong> <strong>the</strong> Ross Sea (28 Oc<strong>to</strong>ber– 7<br />
November, 2005). Transect sampling for CDOM was conducted<br />
from �49 <strong>to</strong> �75°S. Details of <strong>the</strong> cruise track, sampling<br />
pro<strong>to</strong>cols, analyses conducted and meteoro logical and<br />
sea ice conditions for <strong>the</strong> southbound transect are presented<br />
in Kiene et al. (2007). The transect encompassed open<br />
w<strong>at</strong>ers of <strong>the</strong> Sou<strong>the</strong>rn Ocean, <strong>the</strong> nor<strong>the</strong>rn sea-ice melt<br />
zone, and ice-covered areas near <strong>the</strong> nor<strong>the</strong>rn Ross Sea.<br />
Chlorophyll a was determined fl uorometrically by employing<br />
<strong>the</strong> acidifi c<strong>at</strong>ion method described by Strickland<br />
and Parsons (1968). Briefl y, 50– 250 mL of seaw<strong>at</strong>er was fi ltered<br />
on<strong>to</strong> a 25-mm GF/C glass fi ber fi lter (Wh<strong>at</strong>man Inc.,<br />
Floram Park, New Jersey) with low vacuum. Filters were<br />
placed in 5 mL of 90% HPLC-grade ace<strong>to</strong>ne and extracted<br />
for 24 h <strong>at</strong> – 20°C. Chlorophyll fl uorescence in <strong>the</strong> ace<strong>to</strong>ne<br />
extracts was quantifi ed with a Turner Designs 10-AU fl uorometer<br />
(Sunnyvale, Calafornia) before and after 80-�L addition<br />
of 10% HCl. Dissolved organic carbon samples were