- Page 2 and 3:
Smithsonian at the Poles Contributi
- Page 4 and 5:
Contents FOREWORD by Ira Rubinoff i
- Page 6 and 7:
Elaina Jorgensen, Alaska Fisheries
- Page 8:
CONTENTS vii Watching Star Birth fr
- Page 11 and 12:
x SMITHSONIAN AT THE POLES blooms i
- Page 13 and 14:
xii SMITHSONIAN AT THE POLES Change
- Page 15 and 16:
xiv SMITHSONIAN AT THE POLES Museum
- Page 18 and 19:
Advancing Polar Research and Commun
- Page 20 and 21:
James P. Espy (1785- 1860), the fi
- Page 22 and 23:
ology fueled hopes that the scienti
- Page 24 and 25:
Meteorologists also provided critic
- Page 26 and 27:
visualize weather patterns remotely
- Page 28 and 29:
in ice sheets. The latest collapse
- Page 30 and 31:
Cooperation at the Poles? Placing t
- Page 32 and 33:
British Association for the Advance
- Page 34 and 35:
cations, in which the Smithsonian s
- Page 36 and 37:
ence” (Robinson, 2006: 76), he ha
- Page 38:
Taylor, C. J. 1981. First Internati
- Page 41 and 42:
24 SMITHSONIAN AT THE POLES / KORSM
- Page 43 and 44:
26 SMITHSONIAN AT THE POLES / KORSM
- Page 45 and 46:
28 SMITHSONIAN AT THE POLES / KORSM
- Page 47 and 48:
30 SMITHSONIAN AT THE POLES / KORSM
- Page 49 and 50:
32 SMITHSONIAN AT THE POLES / KORSM
- Page 51 and 52:
34 SMITHSONIAN AT THE POLES / KORSM
- Page 53 and 54:
36 SMITHSONIAN AT THE POLES / De VO
- Page 55 and 56:
38 SMITHSONIAN AT THE POLES / De VO
- Page 57 and 58:
40 SMITHSONIAN AT THE POLES / De VO
- Page 59 and 60:
42 SMITHSONIAN AT THE POLES / De VO
- Page 61 and 62:
44 SMITHSONIAN AT THE POLES / De VO
- Page 63 and 64:
46 SMITHSONIAN AT THE POLES / De VO
- Page 66 and 67:
From Ballooning in the Arctic to 10
- Page 68 and 69:
ern Svalbard in 1896 (Capelotti, 19
- Page 70 and 71:
FIGURE 2. The Andrée campsite in 1
- Page 72 and 73:
National Zoo in Washington, D.C.—
- Page 74 and 75:
FROM BALLOONING TO 10,000-FOOT RUNW
- Page 76 and 77:
e rapidly deployed to South America
- Page 78 and 79:
“Of No Ordinary Importance”: Re
- Page 80 and 81:
1942). Ethnological collecting had
- Page 82 and 83:
group. More importantly, Murdoch’
- Page 84 and 85:
gan to study the question of Indian
- Page 86 and 87:
small museums and culture centers i
- Page 88 and 89:
fer of Alaskan objects and informat
- Page 90 and 91:
fi rst time in polar research— di
- Page 92 and 93:
Boas, Franz. 1888a. “The Central
- Page 94:
Lindsay, Debra. 1993. Science in th
- Page 97 and 98:
80 SMITHSONIAN AT THE POLES / FIENU
- Page 99 and 100:
82 SMITHSONIAN AT THE POLES / FIENU
- Page 101 and 102:
84 SMITHSONIAN AT THE POLES / FIENU
- Page 103 and 104:
86 SMITHSONIAN AT THE POLES / FIENU
- Page 105 and 106:
88 SMITHSONIAN AT THE POLES / FIENU
- Page 107 and 108:
90 SMITHSONIAN AT THE POLES / BURCH
- Page 109 and 110:
92 SMITHSONIAN AT THE POLES / BURCH
- Page 111 and 112:
94 SMITHSONIAN AT THE POLES / BURCH
- Page 113 and 114:
96 SMITHSONIAN AT THE POLES / BURCH
- Page 115 and 116:
98 SMITHSONIAN AT THE POLES / BURCH
- Page 117 and 118:
100 SMITHSONIAN AT THE POLES / CROW
- Page 119 and 120:
102 SMITHSONIAN AT THE POLES / CROW
- Page 121 and 122:
104 SMITHSONIAN AT THE POLES / CROW
- Page 123 and 124:
106 SMITHSONIAN AT THE POLES / CROW
- Page 125 and 126:
108 SMITHSONIAN AT THE POLES / CROW
- Page 127 and 128:
110 SMITHSONIAN AT THE POLES / CROW
- Page 129 and 130:
112 SMITHSONIAN AT THE POLES / CROW
- Page 132 and 133:
From Tent to Trading Post and Back
- Page 134 and 135:
in befriending an extraordinary Inu
- Page 136 and 137:
The Smithsonian Institution’s pre
- Page 138 and 139:
of departure for research during th
- Page 140 and 141:
FIGURE 8. A drawing of the so-calle
- Page 142 and 143:
situated experiential education and
- Page 144:
the Past: Archaeologists, Native Am
- Page 147 and 148:
130 SMITHSONIAN AT THE POLES / KRUP
- Page 149 and 150:
132 SMITHSONIAN AT THE POLES / KRUP
- Page 151 and 152:
134 SMITHSONIAN AT THE POLES / KRUP
- Page 153 and 154:
136 SMITHSONIAN AT THE POLES / KRUP
- Page 155 and 156:
138 SMITHSONIAN AT THE POLES / KRUP
- Page 157 and 158:
140 SMITHSONIAN AT THE POLES / KRUP
- Page 159 and 160:
142 SMITHSONIAN AT THE POLES / KRUP
- Page 161 and 162:
144 SMITHSONIAN AT THE POLES / PARK
- Page 163 and 164:
146 SMITHSONIAN AT THE POLES / PARK
- Page 165 and 166:
148 SMITHSONIAN AT THE POLES / PARK
- Page 167 and 168:
150 SMITHSONIAN AT THE POLES / PARK
- Page 169 and 170:
152 SMITHSONIAN AT THE POLES / PARK
- Page 171 and 172:
154 SMITHSONIAN AT THE POLES / PARK
- Page 173 and 174:
156 SMITHSONIAN AT THE POLES / PARK
- Page 175 and 176:
158 SMITHSONIAN AT THE POLES / PARK
- Page 177 and 178:
160 SMITHSONIAN AT THE POLES / PARK
- Page 179 and 180:
162 SMITHSONIAN AT THE POLES / PARK
- Page 181 and 182:
164 SMITHSONIAN AT THE POLES / PARK
- Page 183 and 184:
166 SMITHSONIAN AT THE POLES / PARK
- Page 185 and 186:
168 SMITHSONIAN AT THE POLES / PARK
- Page 187 and 188:
170 SMITHSONIAN AT THE POLES / PARK
- Page 189 and 190:
172 SMITHSONIAN AT THE POLES / PARK
- Page 191 and 192:
174 SMITHSONIAN AT THE POLES / PARK
- Page 193 and 194:
176 SMITHSONIAN AT THE POLES / PARK
- Page 195 and 196:
178 SMITHSONIAN AT THE POLES / PARK
- Page 198 and 199:
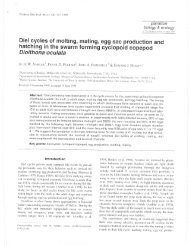
Brooding and Species Diversity in t
- Page 200 and 201:
iefl y consider below some of the i
- Page 202 and 203:
ment. Consequently, the selective e
- Page 204 and 205:
ated from the Antarctic. Strong cur
- Page 206 and 207:
the four main genera of brooding sc
- Page 208 and 209:
ing such cryptic speciation suggest
- Page 210 and 211:
LITERATURE CITED Absher, T. M., G.
- Page 212 and 213:
Madon-Senez, C. 1998. Disparité Mo
- Page 214 and 215:
Persistent Elevated Abundance of Oc
- Page 216 and 217:
ABUNDANCE OF ANTARCTIC OCTOPODS 199
- Page 218 and 219:
ABUNDANCE OF ANTARCTIC OCTOPODS 201
- Page 220:
ABUNDANCE OF ANTARCTIC OCTOPODS 203
- Page 223 and 224:
206 SMITHSONIAN AT THE POLES / WINS
- Page 225 and 226:
208 SMITHSONIAN AT THE POLES / WINS
- Page 227 and 228:
210 SMITHSONIAN AT THE POLES / WINS
- Page 229 and 230:
212 SMITHSONIAN AT THE POLES / WINS
- Page 231 and 232:
214 SMITHSONIAN AT THE POLES / WINS
- Page 233 and 234:
216 SMITHSONIAN AT THE POLES / WINS
- Page 235 and 236:
218 SMITHSONIAN AT THE POLES / WINS
- Page 237 and 238:
220 SMITHSONIAN AT THE POLES / WINS
- Page 240 and 241:
Considerations of Anatomy, Morpholo
- Page 242 and 243:
Many theories have been hypothesize
- Page 244 and 245:
FIGURE 4. A three dimensional recon
- Page 246 and 247:
are wider and more bulbous in the a
- Page 248 and 249: mimicked the shape and profi le of
- Page 250 and 251: faces for SEM observation. The spec
- Page 252 and 253: DISCUSSION Imaging and dissection o
- Page 254 and 255: out its length. The pulp chamber al
- Page 256 and 257: pulpal neurons and dentin tubules.
- Page 258 and 259: Scientifi c Diving Under Ice: A 40-
- Page 260 and 261: TABLE 2. Principal Investigators an
- Page 262 and 263: attaching ice anchors to the chunks
- Page 264 and 265: dumping of weight under water. The
- Page 266 and 267: MARINE LIFE HAZARDS Few polar anima
- Page 268 and 269: Urine should be copious and clear a
- Page 270 and 271: Environmental and Molecular Mechani
- Page 272 and 273: face (�1.8°C) are likely to pose
- Page 274 and 275: FIGURE 2. Illustrated selection shi
- Page 276 and 277: FIGURE 4. Distribution of respirati
- Page 278 and 279: invertebrates were placed in the ba
- Page 280: Meehan, R. R., D. S. Dunican, A. Ru
- Page 283 and 284: 266 SMITHSONIAN AT THE POLES / KOOY
- Page 285 and 286: 268 SMITHSONIAN AT THE POLES / KOOY
- Page 287 and 288: 270 SMITHSONIAN AT THE POLES / KOOY
- Page 289 and 290: 272 SMITHSONIAN AT THE POLES / DUNT
- Page 291 and 292: 274 SMITHSONIAN AT THE POLES / DUNT
- Page 293 and 294: 276 SMITHSONIAN AT THE POLES / DUNT
- Page 295 and 296: 278 SMITHSONIAN AT THE POLES / DUNT
- Page 297: 280 SMITHSONIAN AT THE POLES / DUNT
- Page 301 and 302: 284 SMITHSONIAN AT THE POLES / DUNT
- Page 303 and 304: 286 SMITHSONIAN AT THE POLES / QUET
- Page 305 and 306: 288 SMITHSONIAN AT THE POLES / QUET
- Page 307 and 308: 290 SMITHSONIAN AT THE POLES / QUET
- Page 309 and 310: 292 SMITHSONIAN AT THE POLES / QUET
- Page 311 and 312: 294 SMITHSONIAN AT THE POLES / QUET
- Page 313 and 314: 296 SMITHSONIAN AT THE POLES / QUET
- Page 315 and 316: 298 SMITHSONIAN AT THE POLES / QUET
- Page 317 and 318: 300 SMITHSONIAN AT THE POLES / NEAL
- Page 319 and 320: 302 SMITHSONIAN AT THE POLES / NEAL
- Page 321 and 322: 304 SMITHSONIAN AT THE POLES / NEAL
- Page 323 and 324: 306 SMITHSONIAN AT THE POLES / NEAL
- Page 325 and 326: 308 SMITHSONIAN AT THE POLES / NEAL
- Page 327 and 328: 310 SMITHSONIAN AT THE POLES / SMIT
- Page 329 and 330: 312 SMITHSONIAN AT THE POLES / SMIT
- Page 331 and 332: 314 SMITHSONIAN AT THE POLES / SMIT
- Page 333 and 334: 316 SMITHSONIAN AT THE POLES / SMIT
- Page 335 and 336: 318 SMITHSONIAN AT THE POLES / SMIT
- Page 337 and 338: 320 SMITHSONIAN AT THE POLES / KIEB
- Page 339 and 340: 322 SMITHSONIAN AT THE POLES / KIEB
- Page 341 and 342: 324 SMITHSONIAN AT THE POLES / KIEB
- Page 343 and 344: 326 SMITHSONIAN AT THE POLES / KIEB
- Page 345 and 346: 328 SMITHSONIAN AT THE POLES / KIEB
- Page 347 and 348: 330 SMITHSONIAN AT THE POLES / KIEB
- Page 349 and 350:
332 SMITHSONIAN AT THE POLES / KIEB
- Page 352 and 353:
Capital Expenditure and Income (For
- Page 354 and 355:
tal breeding systems (Boyd, 1998; T
- Page 356 and 357:
FIGURE 3. Pup mass gain in relation
- Page 358 and 359:
MONITORING FOOD CONSUMPTION DURING
- Page 360 and 361:
primary productivity in McMurdo Sou
- Page 362 and 363:
Non-steady-State Systems. Journal o
- Page 364 and 365:
Latitudinal Patterns of Biological
- Page 366 and 367:
and perhaps others, may have invade
- Page 368 and 369:
colonizing the Arctic Ocean under c
- Page 370 and 371:
due in part to the great distances
- Page 372 and 373:
and (2) human-mediated responses to
- Page 374 and 375:
Lewis, P. N., M. Riddle, and C. L.
- Page 376 and 377:
Cosmology from Antarctica Robert W.
- Page 378 and 379:
There they found better observing c
- Page 380 and 381:
TELESCOPES AND INSTRUMENTS AT THE S
- Page 382 and 383:
Gaier, T., J. Schuster, and P. Lubi
- Page 384:
J. M. Kovac, C. L. Kuo, A. E. Lange
- Page 387 and 388:
370 SMITHSONIAN AT THE POLES / MART
- Page 389 and 390:
372 SMITHSONIAN AT THE POLES / MART
- Page 391 and 392:
374 SMITHSONIAN AT THE POLES / WALK
- Page 393 and 394:
376 SMITHSONIAN AT THE POLES / WALK
- Page 395 and 396:
378 SMITHSONIAN AT THE POLES / WALK
- Page 398 and 399:
Watching Star Birth from the Antarc
- Page 400 and 401:
STAR BIRTH FROM THE ANTARCTIC PLATE
- Page 402 and 403:
is constructing and deploying the P
- Page 404 and 405:
Antarctic Meteorites: Exploring the
- Page 406 and 407:
at the Field Museum, and pieces wer
- Page 408 and 409:
the description and curation of Ant
- Page 410 and 411:
led these committees throughout the
- Page 412 and 413:
Index AAUS. See American Academy of
- Page 414 and 415:
temperature, 350-355 tourism, 354 B
- Page 416 and 417:
Fishing. See also Biological invasi
- Page 418 and 419:
McMurdo Station, xiv, 265-267, 393
- Page 420 and 421:
Rogick, Mary, 206 Ronne, Finn, 55 R
- Page 422:
U.S. Naval Support Force Antarctica