Smithsonian at the Poles: Contributions to International Polar
Smithsonian at the Poles: Contributions to International Polar
Smithsonian at the Poles: Contributions to International Polar

You also want an ePaper? Increase the reach of your titles
YUMPU automatically turns print PDFs into web optimized ePapers that Google loves.
are seen <strong>to</strong> increase along with <strong>the</strong> onset of <strong>the</strong> bloom<br />
followed by a second peak occurring in mid-January as<br />
<strong>the</strong> bloom receded. Our d<strong>at</strong>a from Oc<strong>to</strong>ber– November is<br />
very similar <strong>to</strong> Ducklow et al. (2001), but this previous<br />
study and ours differ for <strong>the</strong> December– January period.<br />
We observed rel<strong>at</strong>ively low bacterial numbers <strong>at</strong> <strong>the</strong> end of<br />
December when <strong>the</strong> cruise began. Bacterioplank<strong>to</strong>n <strong>the</strong>n<br />
increased <strong>to</strong> a second peak occurring <strong>at</strong> approxim<strong>at</strong>ely <strong>the</strong><br />
same time as th<strong>at</strong> reported by Ducklow et al. (2001) but <strong>at</strong><br />
a maximum density of only 0.6 � 10 9 cells/L compared <strong>to</strong><br />
<strong>the</strong> �2 � 10 9 cells/L reported in <strong>the</strong> previous study. These<br />
contrasting observ<strong>at</strong>ions may be due <strong>to</strong> differences in specifi<br />
c bloom conditions between years or specifi c sampling<br />
loc<strong>at</strong>ions within <strong>the</strong> Ross Sea. Deployment loc<strong>at</strong>ions and<br />
times of <strong>the</strong> incub<strong>at</strong>ions are given in Table 1. During <strong>the</strong><br />
early-spring (Oc<strong>to</strong>ber– November) cruise, <strong>the</strong> surface was<br />
covered with moder<strong>at</strong>e <strong>to</strong> heavy pack ice interspersed with<br />
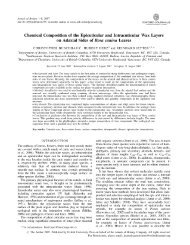
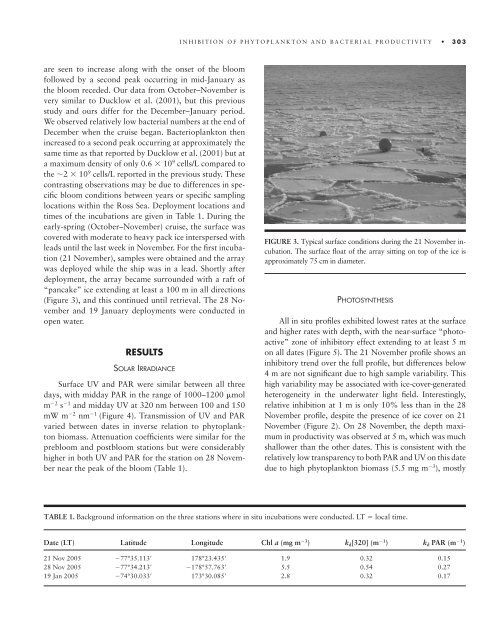
leads until <strong>the</strong> last week in November. For <strong>the</strong> fi rst incub<strong>at</strong>ion<br />
(21 November), samples were obtained and <strong>the</strong> array<br />
was deployed while <strong>the</strong> ship was in a lead. Shortly after<br />
deployment, <strong>the</strong> array became surrounded with a raft of<br />
“pancake” ice extending <strong>at</strong> least a 100 m in all directions<br />
(Figure 3), and this continued until retrieval. The 28 November<br />
and 19 January deployments were conducted in<br />
open w<strong>at</strong>er.<br />
RESULTS<br />
SOLAR IRRADIANCE<br />
Surface UV and PAR were similar between all three<br />
days, with midday PAR in <strong>the</strong> range of 1000– 1200 �mol<br />
m �2 s �1 and midday UV <strong>at</strong> 320 nm between 100 and 150<br />
mW m �2 nm �1 (Figure 4). Transmission of UV and PAR<br />
varied between d<strong>at</strong>es in inverse rel<strong>at</strong>ion <strong>to</strong> phy<strong>to</strong>plank<strong>to</strong>n<br />
biomass. Attenu<strong>at</strong>ion coeffi cients were similar for <strong>the</strong><br />
prebloom and postbloom st<strong>at</strong>ions but were considerably<br />
higher in both UV and PAR for <strong>the</strong> st<strong>at</strong>ion on 28 November<br />
near <strong>the</strong> peak of <strong>the</strong> bloom (Table 1).<br />
INHIBITION OF PHYTOPLANKTON AND BACTERIAL PRODUCTIVITY 303<br />
FIGURE 3. Typical surface conditions during <strong>the</strong> 21 November incub<strong>at</strong>ion.<br />
The surface fl o<strong>at</strong> of <strong>the</strong> array sitting on <strong>to</strong>p of <strong>the</strong> ice is<br />
approxim<strong>at</strong>ely 75 cm in diameter.<br />
PHOTOSYNTHESIS<br />
All in situ profi les exhibited lowest r<strong>at</strong>es <strong>at</strong> <strong>the</strong> surface<br />
and higher r<strong>at</strong>es with depth, with <strong>the</strong> near-surface “pho<strong>to</strong>active”<br />
zone of inhibi<strong>to</strong>ry effect extending <strong>to</strong> <strong>at</strong> least 5 m<br />
on all d<strong>at</strong>es (Figure 5). The 21 November profi le shows an<br />
inhibi<strong>to</strong>ry trend over <strong>the</strong> full profi le, but differences below<br />
4 m are not signifi cant due <strong>to</strong> high sample variability. This<br />
high variability may be associ<strong>at</strong>ed with ice-cover-gener<strong>at</strong>ed<br />
heterogeneity in <strong>the</strong> underw<strong>at</strong>er light fi eld. Interestingly,<br />
rel<strong>at</strong>ive inhibition <strong>at</strong> 1 m is only 10% less than in <strong>the</strong> 28<br />
November profi le, despite <strong>the</strong> presence of ice cover on 21<br />
November (Figure 2). On 28 November, <strong>the</strong> depth maximum<br />
in productivity was observed <strong>at</strong> 5 m, which was much<br />
shallower than <strong>the</strong> o<strong>the</strong>r d<strong>at</strong>es. This is consistent with <strong>the</strong><br />
rel<strong>at</strong>ively low transparency <strong>to</strong> both PAR and UV on this d<strong>at</strong>e<br />
due <strong>to</strong> high phy<strong>to</strong>plank<strong>to</strong>n biomass (5.5 mg m �3 ), mostly<br />
TABLE 1. Background inform<strong>at</strong>ion on <strong>the</strong> three st<strong>at</strong>ions where in situ incub<strong>at</strong>ions were conducted. LT � local time.<br />
D<strong>at</strong>e (LT) L<strong>at</strong>itude Longitude Chl a (mg m �3 ) kd[320] (m �1 ) kd PAR (m �1 )<br />
21 Nov 2005 �77°35.113� 178°23.435� 1.9 0.32 0.15<br />
28 Nov 2005 �77°34.213� �178°57.763� 5.5 0.54 0.27<br />
19 Jan 2005 �74°30.033� 173°30.085� 2.8 0.32 0.17