Smithsonian at the Poles: Contributions to International Polar
Smithsonian at the Poles: Contributions to International Polar
Smithsonian at the Poles: Contributions to International Polar

Create successful ePaper yourself
Turn your PDF publications into a flip-book with our unique Google optimized e-Paper software.
from 400 <strong>to</strong> 700 nm. The irradiance <strong>at</strong> several visible<br />
wavelength channels, centered <strong>at</strong> 412, 443, 490, 510, 555,<br />
and 665 nm, as well as PAR, were determined with a BSI<br />
PRR-600 Profi ling Refl ectance Radiometer coupled <strong>to</strong> a<br />
radiometrically m<strong>at</strong>ched surface reference sensor (PRR-<br />
610). Similarly, both PRR sensors had a sampling r<strong>at</strong>e of<br />
approxim<strong>at</strong>ely 6 Hz and an approxim<strong>at</strong>e bandwidth of<br />
10 nm. The PUV-2500 was deployed multiple times a day<br />
(generally, three <strong>to</strong> fi ve profi les per day) in free-fall mode,<br />
allowing it <strong>to</strong> sample <strong>at</strong> a distance of over 10 m from <strong>the</strong><br />
ship, minimizing effects from ship shadow and instrument<br />
tilt (W<strong>at</strong>ers et al., 1990). The PRR-600 was deployed several<br />
times per st<strong>at</strong>ion in a metal lowering frame via <strong>the</strong><br />
starboard side winch. Prior <strong>to</strong> each cast, <strong>the</strong> ship was oriented<br />
rel<strong>at</strong>ive <strong>to</strong> <strong>the</strong> sun <strong>to</strong> minimize ship shadow. The<br />
GUV-2511 and PRR-610 were mounted <strong>to</strong> <strong>the</strong> deck, and<br />
care was taken <strong>to</strong> avoid shadows or refl ected light associ<strong>at</strong>ed<br />
with <strong>the</strong> ship’s superstructure. To reduce instrument<br />
variability due <strong>to</strong> <strong>at</strong>mospheric temper<strong>at</strong>ure fl uctu<strong>at</strong>ions,<br />
<strong>the</strong> GUV-2511 was equipped with active internal he<strong>at</strong>ing.<br />
All calibr<strong>at</strong>ions utilized coeffi cients provided by BSI, and<br />
<strong>the</strong> d<strong>at</strong>a were processed using standard procedures.<br />
Spectral downwelling <strong>at</strong>tenu<strong>at</strong>ion coeffi cients (Kd(λ),<br />
m �1 ) were derived from each PUV-2500 and PRR-600<br />
profi le as <strong>the</strong> slope of log-transformed Ed(z, λ) versus<br />
depth. On <strong>the</strong> basis of w<strong>at</strong>er clarity, <strong>the</strong> depth interval<br />
for this calcul<strong>at</strong>ion varied from � 10 m for shorter UV<br />
wavelengths up <strong>to</strong> 20-30 m for blue wavelengths of solar<br />
radi<strong>at</strong>ion. Daily mean Kd(λ) were derived as <strong>the</strong> average<br />
of individual Kd(λ) coeffi cients determined from each PUV<br />
and PRR profi le, and st<strong>at</strong>ion means were determined by<br />
averaging <strong>the</strong> daily Kd(λ) coeffi cients.<br />
RESULTS<br />
SAMPLE STORAGE AND SPECTRAL COMPARISON<br />
A s<strong>to</strong>rage test was conducted with seaw<strong>at</strong>er collected<br />
on 29 Oc<strong>to</strong>ber 2005 (52°59.90�S, 175°7.76�E) during <strong>the</strong><br />
transect from New Zealand <strong>to</strong> <strong>the</strong> Ross Sea. The sample<br />
was obtained from <strong>the</strong> ship’s underway pump system th<strong>at</strong><br />
had an intake depth <strong>at</strong> approxim<strong>at</strong>ely 4 m. Seaw<strong>at</strong>er was<br />
fi ltered directly from <strong>the</strong> pump line through a 0.2-µm AS<br />
75 Polycap fi lter capsule in<strong>to</strong> an 80-mL Qorpak bottle<br />
and s<strong>to</strong>red in <strong>the</strong> dark <strong>at</strong> room temper<strong>at</strong>ure. When this<br />
sample was analyzed multiple times over a period of two<br />
weeks (n � 8), no change was observed in its absorption<br />
spectrum with respect <strong>to</strong> spectral absorption coeffi<br />
cients or spectral slopes. For example, a300 varied over a<br />
very narrow range from 0.196 <strong>to</strong> 0.202 m �1 with a mean<br />
CHROMOPHORIC DISSOLVED ORGANIC MATTER CYCLING 323<br />
value of 0.197 m �1 and 3.1% RSD. This RSD is only<br />
slightly larger than <strong>the</strong> RSD for replic<strong>at</strong>e analysis of <strong>the</strong><br />
same sample when done sequentially (�2%). Likewise,<br />
<strong>the</strong> spectral slope from 275 <strong>to</strong> 295 nm (S275-295) showed<br />
very little vari<strong>at</strong>ion over time, ranging from 0.0337 <strong>to</strong><br />
0.0377 nm �1 (0.0358 nm �1 mean and 3.4% RSD). The<br />
S350-400 varied somewh<strong>at</strong> more (11.8% RSD) due <strong>to</strong> <strong>the</strong><br />
lower aλ values, ranging from 0.0075 <strong>to</strong> 0.0111 nm �1 ,<br />
with a mean value of 0.009 nm �1 . A s<strong>to</strong>rage study with<br />
two o<strong>the</strong>r samples th<strong>at</strong> were collected along <strong>the</strong> transect<br />
showed similar results, with very little variability observed<br />
in ei<strong>the</strong>r aλ or S beyond <strong>the</strong> precision of sequential<br />
spectral measurements.<br />
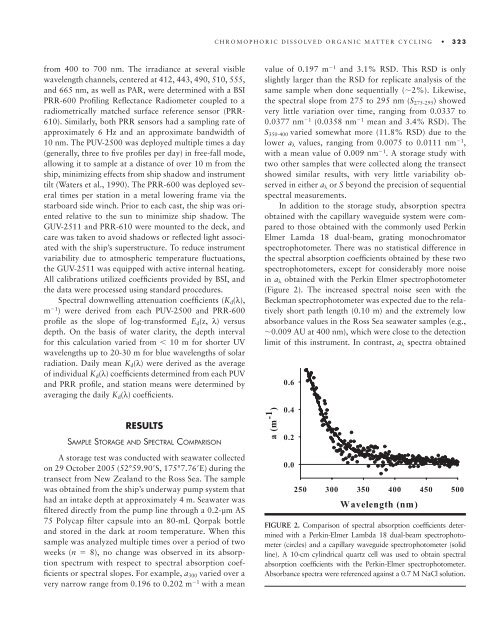
In addition <strong>to</strong> <strong>the</strong> s<strong>to</strong>rage study, absorption spectra<br />
obtained with <strong>the</strong> capillary waveguide system were compared<br />
<strong>to</strong> those obtained with <strong>the</strong> commonly used Perkin<br />
Elmer Lamda 18 dual-beam, gr<strong>at</strong>ing monochrom<strong>at</strong>or<br />
spectropho<strong>to</strong>meter. There was no st<strong>at</strong>istical difference in<br />
<strong>the</strong> spectral absorption coeffi cients obtained by <strong>the</strong>se two<br />
spectropho<strong>to</strong>meters, except for considerably more noise<br />
in aλ obtained with <strong>the</strong> Perkin Elmer spectropho<strong>to</strong>meter<br />
(Figure 2). The increased spectral noise seen with <strong>the</strong><br />
Beckman spectropho<strong>to</strong>meter was expected due <strong>to</strong> <strong>the</strong> rel<strong>at</strong>ively<br />
short p<strong>at</strong>h length (0.10 m) and <strong>the</strong> extremely low<br />
absorbance values in <strong>the</strong> Ross Sea seaw<strong>at</strong>er samples (e.g.,<br />
�0.009 AU <strong>at</strong> 400 nm), which were close <strong>to</strong> <strong>the</strong> detection<br />
limit of this instrument. In contrast, aλ spectra obtained<br />
FIGURE 2. Comparison of spectral absorption coeffi cients determined<br />
with a Perkin-Elmer Lambda 18 dual-beam spectropho<strong>to</strong>meter<br />
(circles) and a capillary waveguide spectropho<strong>to</strong>meter (solid<br />
line). A 10-cm cylindrical quartz cell was used <strong>to</strong> obtain spectral<br />
absorption coeffi cients with <strong>the</strong> Perkin-Elmer spectropho<strong>to</strong>meter.<br />
Absorbance spectra were referenced against a 0.7 M NaCl solution.