Smithsonian at the Poles: Contributions to International Polar
Smithsonian at the Poles: Contributions to International Polar
Smithsonian at the Poles: Contributions to International Polar

You also want an ePaper? Increase the reach of your titles
YUMPU automatically turns print PDFs into web optimized ePapers that Google loves.
DOWNWELLING ATTENUATION COEFFICIENTS<br />
The optical clarity of <strong>the</strong> w<strong>at</strong>er column was reduced<br />
considerably from before <strong>the</strong> onset of <strong>the</strong> Phaeocystis antarctica<br />
bloom <strong>at</strong> st<strong>at</strong>ion R10 <strong>to</strong> <strong>the</strong> end of <strong>the</strong> cruise <strong>at</strong><br />
st<strong>at</strong>ion R14. Before <strong>the</strong> onset of <strong>the</strong> Phaeocystis antarctica<br />
bloom (st<strong>at</strong>ions R10 and R13A– R13D), <strong>the</strong> photic<br />
zone exhibited a high degree of optical clarity, characteristic<br />
of type 1 open oceanic w<strong>at</strong>er (Mobley, 1994), with<br />
Kd(λ) decreasing exponentially in <strong>the</strong> UV with increasing<br />
wavelength and domin<strong>at</strong>ed by absorption by CDOM (Figure<br />
5). Prebloom Kd(λ) shown in Figure 5 for st<strong>at</strong>ion R10<br />
were nearly <strong>the</strong> same as observed <strong>at</strong> st<strong>at</strong>ions R13A– R13D<br />
(d<strong>at</strong>a not shown). For st<strong>at</strong>ion R10, Kd(λ) ranged from 0.30<br />
<strong>to</strong> 0.38 m �1 <strong>at</strong> 305 nm, 0.18– 0.31 m �1 <strong>at</strong> 320 nm, and<br />
0.05– 0.15 m �1 <strong>at</strong> 395 nm. Because of low biomass (chl a<br />
� 0.6 �g L �1 ), <strong>the</strong> lowest values of Kd(λ), and <strong>the</strong>refore<br />
highest degree of optical clarity, were observed in <strong>the</strong> visible<br />
between approxim<strong>at</strong>ely 450 and 500 nm with Kd(λ)<br />
ranging from 0.05 <strong>to</strong> 0.11 m �1 . When <strong>the</strong> bloom started<br />
<strong>to</strong> develop, <strong>the</strong> optical characteristics of <strong>the</strong> w<strong>at</strong>er, includ-<br />
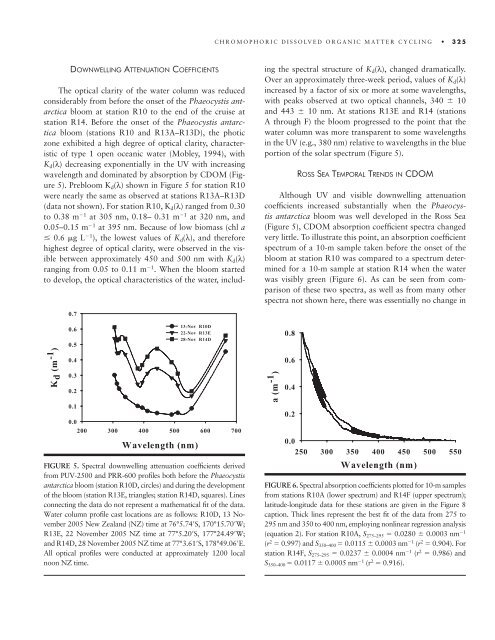
FIGURE 5. Spectral downwelling <strong>at</strong>tenu<strong>at</strong>ion coeffi cients derived<br />
from PUV-2500 and PRR-600 profi les both before <strong>the</strong> Phaeocystis<br />
antarctica bloom (st<strong>at</strong>ion R10D, circles) and during <strong>the</strong> development<br />
of <strong>the</strong> bloom (st<strong>at</strong>ion R13E, triangles; st<strong>at</strong>ion R14D, squares). Lines<br />
connecting <strong>the</strong> d<strong>at</strong>a do not represent a m<strong>at</strong>hem<strong>at</strong>ical fi t of <strong>the</strong> d<strong>at</strong>a.<br />
W<strong>at</strong>er column profi le cast loc<strong>at</strong>ions are as follows: R10D, 13 November<br />
2005 New Zealand (NZ) time <strong>at</strong> 76°5.74�S, 170°15.70�W;<br />
R13E, 22 November 2005 NZ time <strong>at</strong> 77°5.20�S, 177°24.49�W;<br />
and R14D, 28 November 2005 NZ time <strong>at</strong> 77°3.61�S, 178°49.06�E.<br />
All optical profi les were conducted <strong>at</strong> approxim<strong>at</strong>ely 1200 local<br />
noon NZ time.<br />
CHROMOPHORIC DISSOLVED ORGANIC MATTER CYCLING 325<br />
ing <strong>the</strong> spectral structure of Kd(λ), changed dram<strong>at</strong>ically.<br />
Over an approxim<strong>at</strong>ely three-week period, values of Kd(λ)<br />
increased by a fac<strong>to</strong>r of six or more <strong>at</strong> some wavelengths,<br />
with peaks observed <strong>at</strong> two optical channels, 340 � 10<br />
and 443 � 10 nm. At st<strong>at</strong>ions R13E and R14 (st<strong>at</strong>ions<br />
A through F) <strong>the</strong> bloom progressed <strong>to</strong> <strong>the</strong> point th<strong>at</strong> <strong>the</strong><br />
w<strong>at</strong>er column was more transparent <strong>to</strong> some wavelengths<br />
in <strong>the</strong> UV (e.g., 380 nm) rel<strong>at</strong>ive <strong>to</strong> wavelengths in <strong>the</strong> blue<br />
portion of <strong>the</strong> solar spectrum (Figure 5).<br />
ROSS SEA TEMPORAL TRENDS IN CDOM<br />
Although UV and visible downwelling <strong>at</strong>tenu<strong>at</strong>ion<br />
coeffi cients increased substantially when <strong>the</strong> Phaeocystis<br />
antarctica bloom was well developed in <strong>the</strong> Ross Sea<br />
(Figure 5), CDOM absorption coeffi cient spectra changed<br />
very little. To illustr<strong>at</strong>e this point, an absorption coeffi cient<br />
spectrum of a 10-m sample taken before <strong>the</strong> onset of <strong>the</strong><br />
bloom <strong>at</strong> st<strong>at</strong>ion R10 was compared <strong>to</strong> a spectrum determined<br />
for a 10-m sample <strong>at</strong> st<strong>at</strong>ion R14 when <strong>the</strong> w<strong>at</strong>er<br />
was visibly green (Figure 6). As can be seen from comparison<br />
of <strong>the</strong>se two spectra, as well as from many o<strong>the</strong>r<br />
spectra not shown here, <strong>the</strong>re was essentially no change in<br />
FIGURE 6. Spectral absorption coeffi cients plotted for 10-m samples<br />
from st<strong>at</strong>ions R10A (lower spectrum) and R14F (upper spectrum);<br />
l<strong>at</strong>itude-longitude d<strong>at</strong>a for <strong>the</strong>se st<strong>at</strong>ions are given in <strong>the</strong> Figure 8<br />
caption. Thick lines represent <strong>the</strong> best fi t of <strong>the</strong> d<strong>at</strong>a from 275 <strong>to</strong><br />
295 nm and 350 <strong>to</strong> 400 nm, employing nonlinear regression analysis<br />
(equ<strong>at</strong>ion 2). For st<strong>at</strong>ion R10A, S275–295 � 0.0280 � 0.0003 nm �1<br />
(r 2 � 0.997) and S350–400 � 0.0115 � 0.0003 nm �1 (r 2 � 0.904). For<br />
st<strong>at</strong>ion R14F, S275–295 � 0.0237 � 0.0004 nm �1 (r 2 � 0.986) and<br />
S350–400 � 0.0117 � 0.0005 nm �1 (r 2 � 0.916).