PE EIE[R-Rg RESEARCH ON - HJ Andrews Experimental Forest
PE EIE[R-Rg RESEARCH ON - HJ Andrews Experimental Forest
PE EIE[R-Rg RESEARCH ON - HJ Andrews Experimental Forest

You also want an ePaper? Increase the reach of your titles
YUMPU automatically turns print PDFs into web optimized ePapers that Google loves.
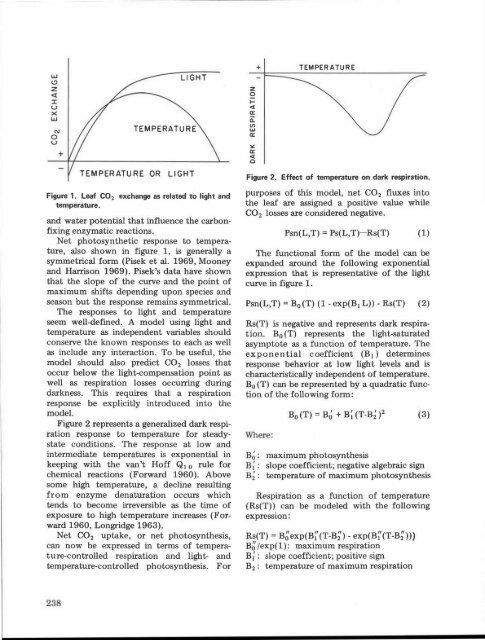
Figure 2. Effect of temperature on dark respiration .<br />
Figure 1 . Leaf CO2 exchange as related to light an d<br />
temperature .<br />
and water potential that influence the carbon -<br />
fixing enzymatic reactions .<br />
Net photosynthetic response to temperature,<br />
also shown in figure 1, is generally a<br />
symmetrical form (Pisek et al . 1969, Moone y<br />
and Harrison 1969). Pisek's data have show n<br />
that the slope of the curve and the point of<br />
maximum shifts depending upon species an d<br />
season but the response remains symmetrical .<br />
The responses to light and temperatur e<br />
seem well-defined. A model using light an d<br />
temperature as independent variables shoul d<br />
conserve the known responses to each as wel l<br />
as include any interaction . To be useful, th e<br />
model should also predict CO 2 losses that<br />
occur below the light-compensation point a s<br />
well as respiration losses occurring durin g<br />
darkness . This requires that a respiratio n<br />
response be explicitly introduced into th e<br />
model.<br />
Figure 2 represents a generalized dark respiration<br />
response to temperature for steady -<br />
state conditions. The response at low an d<br />
intermediate temperatures is exponential i n<br />
keeping with the van 't Hoff Q 1 o rule for<br />
chemical reactions (Forward 1960). Abov e<br />
some high temperature, a decline resultin g<br />
from enzyme denaturation occurs which<br />
tends to become irreversible as the time o f<br />
exposure to high temperature increases (For -<br />
ward 1960, Longridge 1963) .<br />
Net CO 2 uptake, or net photosynthesis ,<br />
can now be expressed in terms of temperature-controlled<br />
respiration and light- an d<br />
temperature-controlled photosynthesis . For<br />
purposes of this model, net CO 2 fluxes int o<br />
the leaf are assigned a positive value whil e<br />
CO 2 losses are considered negative .<br />
Psn(L,T) = Ps(L,T)-Rs(T) (1)<br />
The functional form of the model can b e<br />
expanded around the following exponential<br />
expression that is representative of the ligh t<br />
curve in figure 1 .<br />
Psn(L,T) = Bo(T) (1 - exp(B 1 L)) - Rs(T) (2 )<br />
Rs(T) is negative and represents dark respiration<br />
. Bo(T) represents the light-saturate d<br />
asymptote as a function of temperature . Th e<br />
exponential coefficient (B 1 ) determine s<br />
response behavior at low light levels and is<br />
characteristically independent of temperature .<br />
Bo (T) can be represented by a quadratic function<br />
of the following form :<br />
Where :<br />
B o (T) = Bo + B i (T-B ) 2 (3 )<br />
Bo : maximum photosynthesi s<br />
B ; : slope coefficient ; negative algebraic sign<br />
B2 : temperature of maximum photosynthesi s<br />
Respiration as a function of temperature<br />
(Rs(T)) can be modeled with the followin g<br />
expression :<br />
Rs(T) = Boexp(BI (T-B.) - exp(BI (T-B . )) )<br />
Bo /exp(1) : maximum respiratio n<br />
B1 : slope coefficient ; positive sign<br />
B 2 : temperature of maximum respiratio n<br />
238