PE EIE[R-Rg RESEARCH ON - HJ Andrews Experimental Forest
PE EIE[R-Rg RESEARCH ON - HJ Andrews Experimental Forest
PE EIE[R-Rg RESEARCH ON - HJ Andrews Experimental Forest

Create successful ePaper yourself
Turn your PDF publications into a flip-book with our unique Google optimized e-Paper software.
Latent energy was the largest dissipation<br />
term on each of the days, totaling -28 0<br />
cal/cm 2 for July 29 and -102 cal/cm 2 on July<br />
31 . There was a net loss of latent energy b y<br />
night, as well as by daylight, for both days .<br />
The evaporation equivalent of the laten t<br />
energy total was about 0 .5 cm on July 29 ,<br />
and 0 .18 cm on July 31 .<br />
The Bowen ratio ((3 =H/AE) is a measure of<br />
how the surface partitions the energy suppl y<br />
between sensible and latent heat . The mean<br />
daily value of 13 was 0.48 for the clear day ,<br />
and 0 .38 for the overcast day. The differenc e<br />
in (3 between days is not large, but it suggest s<br />
that the forest partitioned more of the energy<br />
supply into convection on the clear day tha n<br />
on the overcast day . From another viewpoint,<br />
the ratio of XE/Q* was 0 .67 on the sunn y<br />
day, and 0 .76 on the overcast day . This is i n<br />
the direction that one might expect for a<br />
stand of vegetation that receives a large inpu t<br />
of energy .<br />
Hourly Energy Budgets<br />
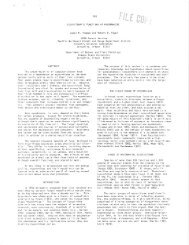
The phase relationships among the energy<br />
budget components can be examined with the<br />
aid of figure 2 which shows the hourly value s<br />
on July 29, and figure 3 which shows th e<br />
hourly values on July 31 . Each plotted poin t<br />
represents the midpoint of an hourly mean .<br />
The daytime, night and daily totals in table 1<br />
were integrated from the rates shown in thes e<br />
two figures . The 2 days exhibit different characteristics,<br />
so they will be discussed separately .<br />
The symmetry of the bell-shaped net radiation<br />
curve on July 29 confirms that the skie s<br />
were cloudless on that day . The maximu m<br />
intensity occurred during the hour centere d<br />
on 1300 hours PDT, which closely corresponded<br />
with solar noon . The net radiation<br />
values became positive about 1 hour after sun -<br />
rise and remained positive until shortly befor e<br />
sunset, indicating the hours in which there<br />
was a surplus of energy that might be dissipated<br />
through the other energy budget components.<br />
The net radiation was negative<br />
throughout the night, as the surface lost<br />
energy to the atmosphere. The greatest net<br />
radiation loss occurred at 2200, about 1 hou r<br />
after sunset at a time when the forest wes<br />
rapidly losing the absorbed solar radiatio n<br />
that had been stored during the day .<br />
The phase of the fluxes is also of interest ,<br />
4 8 10 12 14 16 18 20 22 24<br />
TIME, HR (PDT )<br />
Figure 2. Energy budget components under clear skies . Symbols: net radiation, Q* ; change in heat storage of<br />
soil and biomass, G ; convection, H ; latent energy, AE .<br />
250