PE EIE[R-Rg RESEARCH ON - HJ Andrews Experimental Forest
PE EIE[R-Rg RESEARCH ON - HJ Andrews Experimental Forest
PE EIE[R-Rg RESEARCH ON - HJ Andrews Experimental Forest

You also want an ePaper? Increase the reach of your titles
YUMPU automatically turns print PDFs into web optimized ePapers that Google loves.
The important interaction between light<br />
and temperature can best be shown by numerical<br />
example . Table 1 shows the predicted<br />
temperature of maximum net photosynthesis ,<br />
or optimum temperature, and the peaks of<br />
net photosynthesis for each of five levels of<br />
light. Both the optimum temperature and th e<br />
peaks of net photosynthesis increase with<br />
light. The latter is exemplary of photosynthetic<br />
light saturation .<br />
Table 1. Predicted effect of light on<br />
maximum net photosynthesis<br />
Light Relative Temperature of<br />
ly/min maximum Psn maximum Psn<br />
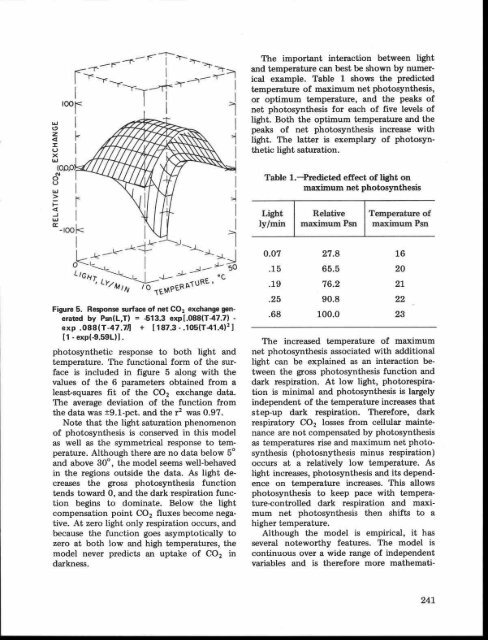
Figure 5 . Response surface of net CO 2 exchange generated<br />
by Psn(L,T) = -513.3 exp[ .088(T-47.7) -<br />
exp .088(T-47.71] + [187 .3 - .105(T-41 .41 2 1<br />
[1 - exp(-9.59L)] .<br />
photosynthetic response to both light an d<br />
temperature . The functional form of the surface<br />
is included in figure 5 along with th e<br />
values of the 6 parameters obtained from a<br />
least-squares fit of the CO 2 exchange data.<br />
The average deviation of the function fro m<br />
the data was ±9 .1-pct . and the r 2 was 0 .97 .<br />
Note that the light saturation phenomeno n<br />
of photosynthesis is conserved in this model<br />
as well as the symmetrical response to temperature.<br />
Although there are no data below 5 °<br />
and above 30°, the model seems well-behave d<br />
in the regions outside the data. As light decreases<br />
the gross photosynthesis functio n<br />
tends toward 0, and the dark respiration function<br />
begins to dominate . Below the light<br />
compensation point CO 2 fluxes become negative.<br />
At zero light only respiration occurs, an d<br />
because the function goes asymptotically t o<br />
zero at both low and high temperatures, the<br />
model never predicts an uptake of CO 2 in<br />
darkness .<br />
0 .07 27 .8 1 6<br />
.15 65 .5 2 0<br />
.19 76 .2 2 1<br />
.25 90 .8 2 2<br />
.68 100 .0 23<br />
The increased temperature of maximu m<br />
net photosynthesis associated with additiona l<br />
light can be explained as an interaction between<br />
the gross photosynthesis function an d<br />
dark respiration . At low light, photorespiration<br />
is minimal and photosynthesis is largely<br />
independent of the temperature increases that<br />
step-up dark respiration . Therefore, dark<br />
respiratory CO 2 losses from cellular maintenance<br />
are not compensated by photosynthesis<br />
as temperatures rise and maximum net photo -<br />
synthesis (photosnythesis minus respiration )<br />
occurs at a relatively low temperature . As<br />
light increases, photosynthesis and its depend -<br />
ence on temperature increases . This allows<br />
photosynthesis to keep pace with temperature-controlled<br />
dark respiration and maxi -<br />
mum net photosynthesis then shifts to a<br />
higher temperature .<br />
Although the model is empirical, it has<br />
several noteworthy features . The model is<br />
continuous over a wide range of independent<br />
variables and is therefore more mathemati-<br />
24 1