PE EIE[R-Rg RESEARCH ON - HJ Andrews Experimental Forest
PE EIE[R-Rg RESEARCH ON - HJ Andrews Experimental Forest
PE EIE[R-Rg RESEARCH ON - HJ Andrews Experimental Forest

Create successful ePaper yourself
Turn your PDF publications into a flip-book with our unique Google optimized e-Paper software.
coast. Without the benefit of good photo -<br />
synthetic data, we used laboratory studie s<br />
conducted by our colleague, D . P. Lavender .<br />
Lavender found that the dry weight increas e<br />
of Douglas-fir seedlings was closely related to<br />
both air and soil temperatures . With these<br />
data a temperature-plant index was develope d<br />
by summing the potential growth possible for<br />
each day during the growing season (Cleary<br />
and Waring 1969) . Other variables were<br />
assumed nonlimiting. In the field, the Temperature<br />
Growth Index ranged from 30 near<br />
timberline to nearly 100 on oak and pin e<br />
forests. Douglas-fir was not found where th e<br />
index was below 40 .<br />
To visualize this information more effectively,<br />
the distributions of selected conifer s<br />
are presented in relation to these two rathe r<br />
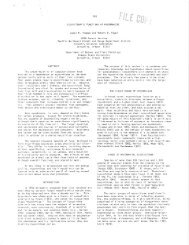
simple plant response indices (fig. 4). The distributional<br />
patterns closely reflect the adapta -<br />
I . I . I I<br />
10 20 30<br />
PLANT MOISTURE STRESS, ATM .<br />
Figure 4 . Distribution of natural regeneration in relation<br />
to gradients of moisture and temperature de -<br />
fined by plant response indices (Waring 1970) .<br />
Validation stands, symbolized by 0, had vegetation<br />
predicted by the intercept of their plant<br />
response indices .<br />
tion of the various conifers . In a local region ,<br />
the variation in distribution of different<br />
species provides a means of predicting the environment<br />
through association with measurements<br />
taken on reference plants . The plan t<br />
response indices were correctly predicte d<br />
from knowledge of plant distributions fo r<br />
three validation stands, indicated as divide d<br />
circles in figure 4 . It is significant that suc h<br />
predictions are possible without physiological<br />
observations on species other than the reference<br />
plants and without special attention t o<br />
events controlling establishment . Once such<br />
relationships are established, the vegetatio n<br />
can provide understanding of the operational<br />
environment without requiring additional<br />
measurements of any kind . We shall expand<br />
this idea later .<br />
Measurement and Interpretation of<br />
Stomatal Respons e<br />
Conifer stomata are most difficult to observe,<br />
usually being sunken and occluded b y<br />
wax . The resistance which they offer to th e<br />
transfer of water vapor from the interior of<br />
the needles can be assessed by determinin g<br />
the rate of water vapor movement with a<br />
diffusion porometer (Waggoner and Turne r<br />
1971). The aperture of stomata may be estimated<br />
by observing the pressure necessary t o<br />
force a 50-percent ethanol solution through<br />
the pores (Fry and Walker 1967). Th e<br />
diffusion resistance is then determined by<br />
calibrating these pressures with reduction i n<br />
transpiration under known vapor pressure<br />
gradients (Reed 1971) . The latter procedure<br />
was followed in our past fieldwork . We found<br />
that stomatal resistance increased as the soi l<br />
moisture became less available during th e<br />
growing season . Further increase in stomatal<br />
resistance was possible during the day i f<br />
evaporative stress was high . These relationships<br />
were quantified and developed into a<br />
simulation model by Reed (1971) . Wit h<br />
knowledge of temperature, humidity, and<br />
nocturnal plant water stress, the model predicted<br />
on a daily basis, both potential transpiration<br />
(PT) and transpiration (T) wit h<br />
stomatal control . These values were summed<br />
for the entire season and confirmed the obser -<br />
85