PE EIE[R-Rg RESEARCH ON - HJ Andrews Experimental Forest
PE EIE[R-Rg RESEARCH ON - HJ Andrews Experimental Forest
PE EIE[R-Rg RESEARCH ON - HJ Andrews Experimental Forest

Create successful ePaper yourself
Turn your PDF publications into a flip-book with our unique Google optimized e-Paper software.
0.4<br />
0.2<br />
v 0<br />
0<br />
w<br />
IX -0.2<br />
I-<br />
cr -0.4<br />
w<br />
-0.6<br />
~ 0.04<br />
A ..29<br />
JULY<br />
HOUR (PDT) -->- y y g i<br />
0 I 2 3 4 5 6 7 1I I 1 1! I r 17 .19 202122 23 2 4<br />
9 10 II 12 13 14 15 16 o 18<br />
B. 31 JULY<br />
r<br />
a<br />
I<br />
2 3 4 5 6 7 8 9<br />
HOUR (PDT)----4 .-<br />
10<br />
I I<br />
2.03.122! J<br />
1213 14 15 16 17 18 19 ° 1 23 24<br />
0- I<br />
u<br />
-0.04 • MB<br />
VAPOR PRESSURE, M B<br />
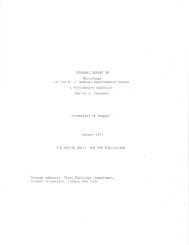
Figure 1 . Similarity between gradients of potential temperature and vapor pressure . A. Clear weather on Jul y<br />
29, 1971 . Levels 1, 4, and 6 . B . Overcast weather on July 31, 1971 . Levels 1, 2, and 3 .<br />
ment of a and e with respect to the firs t<br />
measurement level near the canopy .<br />
Though several points can be deduced fro m<br />
such similarity plots, the most important conclusion<br />
concerns adequacy of data . The linearity<br />
at the selected levels confirms their<br />
acceptability for the Bowen ratio model ,<br />
although an unexplained offset is evident at<br />
level 2 during the 1000-1200 hours on Jul y<br />
31 .<br />
Once the data is judged acceptable, on e<br />
notes that the slope of the lines is A&/Ae ; this<br />
is directly proportional to 0, the Bowen ratio ,<br />
as shown in equation 3 . Thus the relative<br />
slope of the similarity plots is an index to th e<br />
way that the surface is partitioning the net<br />
energy supply into convection and evaporation.<br />
Further, the quadrant of each hourl y<br />
plot indicates the sign of 0, and the direction<br />
of the H and XE fluxes .<br />
For example, as plotted in figure 1A and<br />
1B, both fluxes will have the same sense in<br />
quadrants I and III where the slope is positiv e<br />
((3>0). In quadrant I, H and XE are both directed<br />
away from the surface and are negative<br />
by the sign convention adopted earlier . In<br />
quadrant III, H and XE are both positive, a s<br />
their sense is toward the surface . The slop e<br />
and the (3 coefficient are negative in quadrant s<br />
II and IV. In quadrant II, H is toward th e<br />
surface (advection) while XE is directed away ,<br />
while the fluxes in quadrant IV have th e<br />
opposite sense . The similarity plots can thu s<br />
provide three things : a ready indication of the<br />
magnitude of the Bowen ratio ; an indicatio n<br />
of the direction of the H and E fluxes ; and an<br />
identification of levels suited for the Bowe n<br />
ratio analysis .<br />
247