Abstracts (PDF file, 1.8MB) - Society for Risk Analysis
Abstracts (PDF file, 1.8MB) - Society for Risk Analysis
Abstracts (PDF file, 1.8MB) - Society for Risk Analysis
Create successful ePaper yourself
Turn your PDF publications into a flip-book with our unique Google optimized e-Paper software.
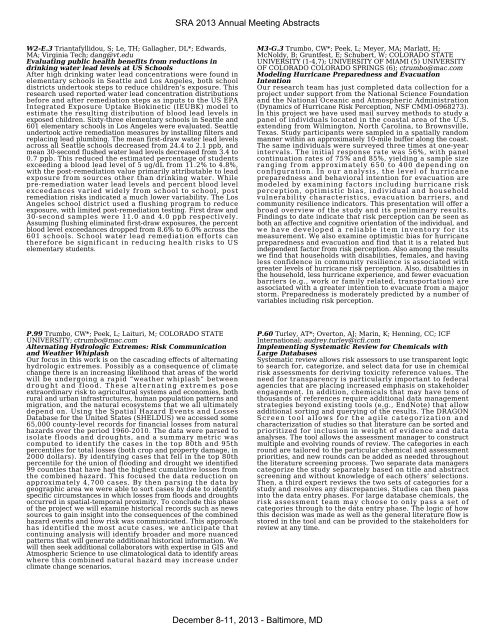
SRA 2013 Annual Meeting <strong>Abstracts</strong><br />
W2-E.3 Triantafyllidou, S; Le, TH; Gallagher, DL*; Edwards,<br />
MA; Virginia Tech; dang@vt.edu<br />
Evaluating public health benefits from reductions in<br />
drinking water lead levels at US Schools<br />
After high drinking water lead concentrations were found in<br />
elementary schools in Seattle and Los Angeles, both school<br />
districts undertook steps to reduce children’s exposure. This<br />
research used reported water lead concentration distributions<br />
be<strong>for</strong>e and after remediation steps as inputs to the US EPA<br />
Integrated Exposure Uptake Biokinetic (IEUBK) model to<br />
estimate the resulting distribution of blood lead levels in<br />
exposed children. Sixty-three elementary schools in Seattle and<br />
601 elementary schools in Los Angeles were evaluated. Seattle<br />
undertook active remediation measures by installing filters and<br />
replacing lead plumbing. The mean first-draw water lead levels<br />
across all Seattle schools decreased from 24.4 to 2.1 ppb, and<br />
mean 30-second flushed water lead levels decreased from 3.4 to<br />
0.7 ppb. This reduced the estimated percentage of students<br />
exceeding a blood lead level of 5 ug/dL from 11.2% to 4.8%,<br />
with the post-remediation value primarily attributable to lead<br />
exposure from sources other than drinking water. While<br />
pre-remediation water lead levels and percent blood level<br />
exceedances varied widely from school to school, post<br />
remediation risks indicated a much lower variability. The Los<br />
Angeles school district used a flushing program to reduce<br />
exposure, with limited post-remediation testing. First draw and<br />
30-second samples were 11.0 and 4.0 ppb respectively.<br />
Assuming flushing eliminated first-draw exposures, the percent<br />
blood level exceedances dropped from 8.6% to 6.0% across the<br />
601 schools. School water lead remediation ef<strong>for</strong>ts can<br />
there<strong>for</strong>e be significant in reducing health risks to US<br />
elementary students.<br />
M3-G.3 Trumbo, CW*; Peek, L; Meyer, MA; Marlatt, H;<br />
McNoldy, B; Gruntfest, E; Schubert, W; COLORADO STATE<br />
UNIVERSITY (1-4,7); UNIVERSITY OF MIAMI (5) UNIVERSITY<br />
OF COLORADO COLORADO SPRINGS (6); ctrumbo@mac.com<br />
Modeling Hurricane Preparedness and Evacuation<br />
Intention<br />
Our research team has just completed data collection <strong>for</strong> a<br />
project under support from the National Science Foundation<br />
and the National Oceanic and Atmospheric Administration<br />
(Dynamics of Hurricane <strong>Risk</strong> Perception, NSF CMMI-0968273).<br />
In this project we have used mail survey methods to study a<br />
panel of individuals located in the coastal area of the U.S.<br />
extending from Wilmington, North Carolina, to Brownsville,<br />
Texas. Study participants were sampled in a spatially random<br />
manner within an approximately 10-mile buffer along the coast.<br />
The same individuals were surveyed three times at one-year<br />
intervals. The initial response rate was 56%, with panel<br />
continuation rates of 75% and 85%, yielding a sample size<br />
ranging from approximately 650 to 400 depending on<br />
configuration. In our analysis, the level of hurricane<br />
preparedness and behavioral intention <strong>for</strong> evacuation are<br />
modeled by examining factors including hurricane risk<br />
perception, optimistic bias, individual and household<br />
vulnerability characteristics, evacuation barriers, and<br />
community resilience indicators. This presentation will offer a<br />
broad overview of the study and its preliminary results.<br />
Findings to date indicate that risk perception can be seen as<br />
both an affective and cognitive orientation of the individual, and<br />
we have developed a reliable item inventory <strong>for</strong> its<br />
measurement. We also examine optimistic bias <strong>for</strong> hurricane<br />
preparedness and evacuation and find that it is a related but<br />
independent factor from risk perception. Also among the results<br />
we find that households with disabilities, females, and having<br />
less confidence in community resilience is associated with<br />
greater levels of hurricane risk perception. Also, disabilities in<br />
the household, less hurricane experience, and fewer evacuation<br />
barriers (e.g., work or family related, transportation) are<br />
associated with a greater intention to evacuate from a major<br />
storm. Preparedness is moderately predicted by a number of<br />
variables including risk perception.<br />
P.99 Trumbo, CW*; Peek, L; Laituri, M; COLORADO STATE<br />
UNIVERSITY; ctrumbo@mac.com<br />
Alternating Hydrologic Extremes: <strong>Risk</strong> Communication<br />
and Weather Whiplash<br />
Our focus in this work is on the cascading effects of alternating<br />
hydrologic extremes. Possibly as a consequence of climate<br />
change there is an increasing likelihood that areas of the world<br />
will be undergoing a rapid “weather whiplash” between<br />
drought and flood. These alternating extremes pose<br />
extraordinary risk to agricultural systems and economies, both<br />
rural and urban infrastructures, human population patterns and<br />
migration, and the natural ecosystems that we all ultimately<br />
depend on. Using the Spatial Hazard Events and Losses<br />
Database <strong>for</strong> the United States (SHELDUS) we accessed some<br />
65,000 county-level records <strong>for</strong> financial losses from natural<br />
hazards over the period 1960-2010. The data were parsed to<br />
isolate floods and droughts, and a summary metric was<br />
computed to identify the cases in the top 80th and 95th<br />
percentiles <strong>for</strong> total losses (both crop and property damage, in<br />
2000 dollars). By identifying cases that fell in the top 80th<br />
percentile <strong>for</strong> the union of flooding and drought we identified<br />
99 counties that have had the highest cumulative losses from<br />
the combined hazard. This focused the data reduction on<br />
approximately 4,700 cases. By then parsing the data by<br />
geographic area we were able to sort cases by date to identify<br />
specific circumstances in which losses from floods and droughts<br />
occurred in spatial-temporal proximity. To conclude this phase<br />
of the project we will examine historical records such as news<br />
sources to gain insight into the consequences of the combined<br />
hazard events and how risk was communicated. This approach<br />
has identified the most acute cases, we anticipate that<br />
continuing analysis will identify broader and more nuanced<br />
patterns that will generate additional historical in<strong>for</strong>mation. We<br />
will then seek additional collaborators with expertise in GIS and<br />
Atmospheric Science to use climatological data to identify areas<br />
where this combined natural hazard may increase under<br />
climate change scenarios.<br />
P.60 Turley, AT*; Overton, AJ; Marin, K; Henning, CC; ICF<br />
International; audrey.turley@icfi.com<br />
Implementing Systematic Review <strong>for</strong> Chemicals with<br />
Large Databases<br />
Systematic review allows risk assessors to use transparent logic<br />
to search <strong>for</strong>, categorize, and select data <strong>for</strong> use in chemical<br />
risk assessments <strong>for</strong> deriving toxicity reference values. The<br />
need <strong>for</strong> transparency is particularly important to federal<br />
agencies that are placing increased emphasis on stakeholder<br />
engagement. In addition, chemicals that may have tens of<br />
thousands of references require additional data management<br />
strategies beyond existing tools (e.g., EndNote) that allow<br />
additional sorting and querying of the results. The DRAGON<br />
Screen tool allows <strong>for</strong> the agile categorization and<br />
characterization of studies so that literature can be sorted and<br />
prioritized <strong>for</strong> inclusion in weight of evidence and data<br />
analyses. The tool allows the assessment manager to construct<br />
multiple and evolving rounds of review. The categories in each<br />
round are tailored to the particular chemical and assessment<br />
priorities, and new rounds can be added as needed throughout<br />
the literature screening process. Two separate data managers<br />
categorize the study separately based on title and abstract<br />
screening and without knowledge of each others’ selections.<br />
Then, a third expert reviews the two sets of categories <strong>for</strong> a<br />
study and resolves any discrepancies. Studies can then pass<br />
into the data entry phases. For large database chemicals, the<br />
risk assessment team may choose to only pass a set of<br />
categories through to the data entry phase. The logic of how<br />
this decision was made as well as the general literature flow is<br />
stored in the tool and can be provided to the stakeholders <strong>for</strong><br />
review at any time.<br />
December 8-11, 2013 - Baltimore, MD


