Abstracts (PDF file, 1.8MB) - Society for Risk Analysis
Abstracts (PDF file, 1.8MB) - Society for Risk Analysis
Abstracts (PDF file, 1.8MB) - Society for Risk Analysis
You also want an ePaper? Increase the reach of your titles
YUMPU automatically turns print PDFs into web optimized ePapers that Google loves.
SRA 2013 Annual Meeting <strong>Abstracts</strong><br />
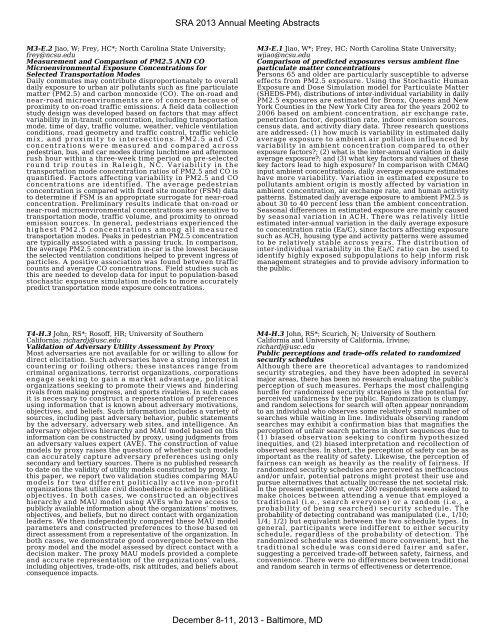
M3-E.2 Jiao, W; Frey, HC*; North Carolina State University;<br />
frey@ncsu.edu<br />
Measurement and Comparison of PM2.5 AND CO<br />
Microenvironmental Exposure Concentrations <strong>for</strong><br />
Selected Transportation Modes<br />
Daily commutes may contribute disproportionately to overall<br />
daily exposure to urban air pollutants such as fine particulate<br />
matter (PM2.5) and carbon monoxide (CO). The on-road and<br />
near-road microenvironments are of concern because of<br />
proximity to on-road traffic emissions. A field data collection<br />
study design was developed based on factors that may affect<br />
variability in in-transit concentration, including transportation<br />
mode, time of day, traffic volume, weather, vehicle ventilation<br />
conditions, road geometry and traffic control, traffic vehicle<br />
mix, and proximity to intersections. PM2.5 and CO<br />
concentrations were measured and compared across<br />
pedestrian, bus, and car modes during lunchtime and afternoon<br />
rush hour within a three-week time period on pre-selected<br />
round trip routes in Raleigh, NC. Variability in the<br />
transportation mode concentration ratios of PM2.5 and CO is<br />
quantified. Factors affecting variability in PM2.5 and CO<br />
concentrations are identified. The average pedestrian<br />
concentration is compared with fixed site monitor (FSM) data<br />
to determine if FSM is an appropriate surrogate <strong>for</strong> near-road<br />
concentration. Preliminary results indicate that on-road or<br />
near-road microenvironmental concentrations are sensitive to<br />
transportation mode, traffic volume, and proximity to onroad<br />
emission sources. In general, pedestrians experienced the<br />
highest PM2.5 concentrations among all measured<br />
transportation modes. Peaks in pedestrian PM2.5 concentration<br />
are typically associated with a passing truck. In comparison,<br />
the average PM2.5 concentration in-car is the lowest because<br />
the selected ventilation conditions helped to prevent ingress of<br />
particles. A positive association was found between traffic<br />
counts and average CO concentrations. Field studies such as<br />
this are needed to develop data <strong>for</strong> input to population-based<br />
stochastic exposure simulation models to more accurately<br />
predict transportation mode exposure concentrations.<br />
M3-E.1 Jiao, W*; Frey, HC; North Carolina State University;<br />
wjiao@ncsu.edu<br />
Comparison of predicted exposures versus ambient fine<br />
particulate matter concentrations<br />
Persons 65 and older are particularly susceptible to adverse<br />
effects from PM2.5 exposure. Using the Stochastic Human<br />
Exposure and Dose Simulation model <strong>for</strong> Particulate Matter<br />
(SHEDS-PM), distributions of inter-individual variability in daily<br />
PM2.5 exposures are estimated <strong>for</strong> Bronx, Queens and New<br />
York Counties in the New York City area <strong>for</strong> the years 2002 to<br />
2006 based on ambient concentration, air exchange rate,<br />
penetration factor, deposition rate, indoor emission sources,<br />
census data, and activity diary data. Three research questions<br />
are addressed: (1) how much is variability in estimated daily<br />
average exposure to ambient air pollution influenced by<br />
variability in ambient concentration compared to other<br />
exposure factors?; (2) what is the inter-annual variation in daily<br />
average exposure?; and (3) what key factors and values of these<br />
key factors lead to high exposure? In comparison with CMAQ<br />
input ambient concentrations, daily average exposure estimates<br />
have more variability. Variation in estimated exposure to<br />
pollutants ambient origin is mostly affected by variation in<br />
ambient concentration, air exchange rate, and human activity<br />
patterns. Estimated daily average exposure to ambient PM2.5 is<br />
about 30 to 40 percent less than the ambient concentration.<br />
Seasonal differences in estimated exposure are mainly caused<br />
by seasonal variation in ACH. There was relatively little<br />
estimated inter-annual variation in the daily average exposure<br />
to concentration ratio (Ea/C), since factors affecting exposure<br />
such as ACH, housing type and activity patterns were assumed<br />
to be relatively stable across years. The distribution of<br />
inter-individual variability in the Ea/C ratio can be used to<br />
identify highly exposed subpopulations to help in<strong>for</strong>m risk<br />
management strategies and to provide advisory in<strong>for</strong>mation to<br />
the public.<br />
T4-H.3 John, RS*; Rosoff, HR; University of Southern<br />
Cali<strong>for</strong>nia; richardj@usc.edu<br />
Validation of Adversary Utility Assessment by Proxy<br />
Most adversaries are not available <strong>for</strong> or willing to allow <strong>for</strong><br />
direct elicitation. Such adversaries have a strong interest in<br />
countering or foiling others; these instances range from<br />
criminal organizations, terrorist organizations, corporations<br />
engage seeking to gain a market advantage, political<br />
organizations seeking to promote their views and hindering<br />
rivals from making progress, and sports rivalries. In such cases<br />
it is necessary to construct a representation of preferences<br />
using in<strong>for</strong>mation that is known about adversary motivations,<br />
objectives, and beliefs. Such in<strong>for</strong>mation includes a variety of<br />
sources, including past adversary behavior, public statements<br />
by the adversary, adversary web sites, and intelligence. An<br />
adversary objectives hierarchy and MAU model based on this<br />
in<strong>for</strong>mation can be constructed by proxy, using judgments from<br />
an adversary values expert (AVE). The construction of value<br />
models by proxy raises the question of whether such models<br />
can accurately capture adversary preferences using only<br />
secondary and tertiary sources. There is no published research<br />
to date on the validity of utility models constructed by proxy. In<br />
this paper, we report two validation studies comparing MAU<br />
models <strong>for</strong> two different politically active non-profit<br />
organizations that utilize civil disobedience to achieve political<br />
objectives. In both cases, we constructed an objectives<br />
hierarchy and MAU model using AVEs who have access to<br />
publicly available in<strong>for</strong>mation about the organizations’ motives,<br />
objectives, and beliefs, but no direct contact with organization<br />
leaders. We then independently compared these MAU model<br />
parameters and constructed preferences to those based on<br />
direct assessment from a representative of the organization. In<br />
both cases, we demonstrate good convergence between the<br />
proxy model and the model assessed by direct contact with a<br />
decision maker. The proxy MAU models provided a complete<br />
and accurate representation of the organizations’ values,<br />
including objectives, trade-offs, risk attitudes, and beliefs about<br />
consequence impacts.<br />
M4-H.3 John, RS*; Scurich, N; University of Southern<br />
Cali<strong>for</strong>nia and University of Cali<strong>for</strong>nia, Irivine;<br />
richardj@usc.edu<br />
Public perceptions and trade-offs related to randomized<br />
security schedules<br />
Although there are theoretical advantages to randomized<br />
security strategies, and they have been adopted in several<br />
major areas, there has been no research evaluating the public’s<br />
perception of such measures. Perhaps the most challenging<br />
hurdle <strong>for</strong> randomized security strategies is the potential <strong>for</strong><br />
perceived unfairness by the public. Randomization is clumpy,<br />
and random selections <strong>for</strong> search will often appear nonrandom<br />
to an individual who observes some relatively small number of<br />
searches while waiting in line. Individuals observing random<br />
searches may exhibit a confirmation bias that magnifies the<br />
perception of unfair search patterns in short sequences due to<br />
(1) biased observation seeking to confirm hypothesized<br />
inequities, and (2) biased interpretation and recollection of<br />
observed searches. In short, the perception of safety can be as<br />
important as the reality of safety. Likewise, the perception of<br />
fairness can weigh as heavily as the reality of fairness. If<br />
randomized security schedules are perceived as inefficacious<br />
and/or unfair, potential patrons might protest their use and<br />
pursue alternatives that actually increase the net societal risk.<br />
In the present experiment, over 200 respondents were asked to<br />
make choices between attending a venue that employed a<br />
traditional (i.e., search everyone) or a random (i.e., a<br />
probability of being searched) security schedule. The<br />
probability of detecting contraband was manipulated (i.e., 1/10;<br />
1/4; 1/2) but equivalent between the two schedule types. In<br />
general, participants were indifferent to either security<br />
schedule, regardless of the probability of detection. The<br />
randomized schedule was deemed more convenient, but the<br />
traditional schedule was considered fairer and safer,<br />
suggesting a perceived trade-off between safety, fairness, and<br />
convenience. There were no differences between traditional<br />
and random search in terms of effectiveness or deterrence.<br />
December 8-11, 2013 - Baltimore, MD


