January 2012 - Sandwell & West Birmingham Hospitals
January 2012 - Sandwell & West Birmingham Hospitals
January 2012 - Sandwell & West Birmingham Hospitals

You also want an ePaper? Increase the reach of your titles
YUMPU automatically turns print PDFs into web optimized ePapers that Google loves.
SWBTB (1/12) 286 (a)<br />
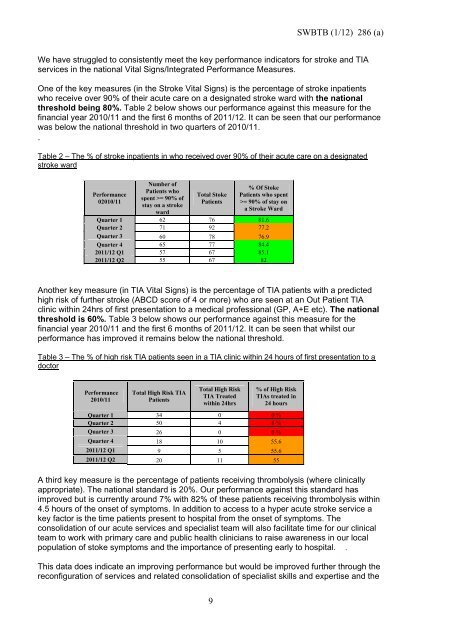
We have struggled to consistently meet the key performance indicators for stroke and TIA<br />
services in the national Vital Signs/Integrated Performance Measures.<br />
One of the key measures (in the Stroke Vital Signs) is the percentage of stroke inpatients<br />
who receive over 90% of their acute care on a designated stroke ward with the national<br />
threshold being 80%. Table 2 below shows our performance against this measure for the<br />
financial year 2010/11 and the first 6 months of 2011/12. It can be seen that our performance<br />
was below the national threshold in two quarters of 2010/11.<br />
.<br />
Table 2 – The % of stroke inpatients in who received over 90% of their acute care on a designated<br />
stroke ward<br />
Performance<br />
02010/11<br />
Number of<br />
Patients who<br />
spent >= 90% of<br />
stay on a stroke<br />
ward<br />
Total Stoke<br />
Patients<br />
% Of Stoke<br />
Patients who spent<br />
>= 90% of stay on<br />
a Stroke Ward<br />
Quarter 1 62 76 81.6<br />
Quarter 2 71 92 77.2<br />
Quarter 3 60 78 76.9<br />
Quarter 4 65 77 84.4<br />
2011/12 Q1 57 67 85.1<br />
2011/12 Q2 55 67 82<br />
Another key measure (in TIA Vital Signs) is the percentage of TIA patients with a predicted<br />
high risk of further stroke (ABCD score of 4 or more) who are seen at an Out Patient TIA<br />
clinic within 24hrs of first presentation to a medical professional (GP, A+E etc). The national<br />
threshold is 60%. Table 3 below shows our performance against this measure for the<br />
financial year 2010/11 and the first 6 months of 2011/12. It can be seen that whilst our<br />
performance has improved it remains below the national threshold.<br />
Table 3 – The % of high risk TIA patients seen in a TIA clinic within 24 hours of first presentation to a<br />
doctor<br />
Performance<br />
2010/11<br />
Total High Risk TIA<br />
Patients<br />
Total High Risk<br />
TIA Treated<br />
within 24hrs<br />
% of High Risk<br />
TIAs treated in<br />
24 hours<br />
Quarter 1 34 0 0 %<br />
Quarter 2 50 4 8 %<br />
Quarter 3 26 0 0 %<br />
Quarter 4 18 10 55.6<br />
2011/12 Q1 9 5 55.6<br />
2011/12 Q2 20 11 55<br />
A third key measure is the percentage of patients receiving thrombolysis (where clinically<br />
appropriate). The national standard is 20%. Our performance against this standard has<br />
improved but is currently around 7% with 82% of these patients receiving thrombolysis within<br />
4.5 hours of the onset of symptoms. In addition to access to a hyper acute stroke service a<br />
key factor is the time patients present to hospital from the onset of symptoms. The<br />
consolidation of our acute services and specialist team will also facilitate time for our clinical<br />
team to work with primary care and public health clinicians to raise awareness in our local<br />
population of stoke symptoms and the importance of presenting early to hospital. .<br />
This data does indicate an improving performance but would be improved further through the<br />
reconfiguration of services and related consolidation of specialist skills and expertise and the<br />
9