January 2012 - Sandwell & West Birmingham Hospitals
January 2012 - Sandwell & West Birmingham Hospitals
January 2012 - Sandwell & West Birmingham Hospitals

Create successful ePaper yourself
Turn your PDF publications into a flip-book with our unique Google optimized e-Paper software.
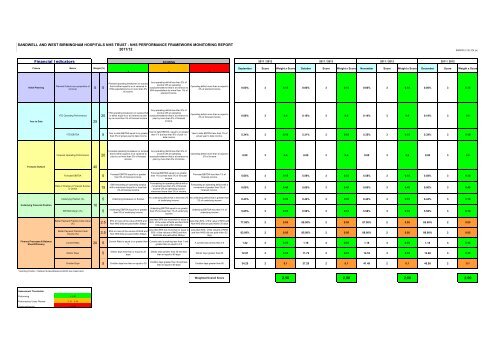
SANDWELL AND WEST BIRMINGHAM HOSPITALS NHS TRUST - NHS PERFORMANCE FRAMEWORK MONITORING REPORT -<br />
2011/12<br />
SWBTB (1/12) 274 (a)<br />
Financial Indicators SCORING 2011 / <strong>2012</strong><br />
2011 / <strong>2012</strong><br />
2011 / <strong>2012</strong><br />
2011 / <strong>2012</strong><br />
Criteria Metric Weight (%)<br />
September Score Weight x Score October Score Weight x Score November Score Weight x Score December Score Weight x Score<br />
3 2 1<br />
Initial Planning<br />
Planned Outturn as a proportion of<br />
turnover 5 5<br />
Planned operating breakeven or surplus<br />
that is either equal to or at variance to<br />
SHA expectations by no more than 3%<br />
of income.<br />
Any operating deficit less than 2% of<br />
income OR an operating<br />
surplus/breakeven that is at variance to<br />
SHA expectations by more than 3% of<br />
planned income.<br />
Operating deficit more than or equal to<br />
2% of planned income<br />
0.00% 3 0.15 0.00% 3<br />
0.15<br />
0.00% 3 0.15<br />
0.00% 3 0.15<br />
Year to Date<br />
YTD Operating Performance<br />
25<br />
20<br />
YTD operating breakeven or surplus that<br />
is either equal to or at variance to plan<br />
by no more than 3% of forecast income.<br />
Any operating deficit less than 2% of<br />
income OR an operating<br />
surplus/breakeven that is at variance to<br />
plan by more than 3% of forecast<br />
income.<br />
Operating deficit more than or equal to<br />
2% of forecast income<br />
0.06% 3 0.6<br />
0.10% 3 0.6<br />
0.14%<br />
3 0.6<br />
0.19% 3 0.6<br />
YTD EBITDA 5<br />
Year to date EBITDA equal to or greater<br />
than 5% of actual year to date income<br />
Year to date EBITDA equal to or greater<br />
than 1% but less than 5% of year to<br />
date income<br />
Year to date EBITDA less than 1% of<br />
actual year to date income.<br />
5.34%<br />
3 0.15 5.31% 3 0.15<br />
5.35% 3 0.15<br />
5.39% 3 0.15<br />
Forecast Operating Performance<br />
20<br />
Forecast operating breakeven or surplus<br />
that is either equal to or at variance to<br />
plan by no more than 3% of forecast<br />
income.<br />
Any operating deficit less than 2% of<br />
income OR an operating<br />
surplus/breakeven that is at variance to<br />
plan by more than 3% of income.<br />
Operating deficit more than or equal to<br />
2% of income<br />
0.00 3<br />
0.6 0.00 3 0.6<br />
0.00 3 0.6<br />
0.00<br />
3 0.6<br />
Forecast Outturn<br />
40<br />
Forecast EBITDA<br />
5<br />
Forecast EBITDA equal to or greater<br />
than 5% of forecast income.<br />
Forecast EBITDA equal to or greater<br />
than 1% but less than 5% of forecast<br />
income.<br />
Forecast EBITDA less than 1% of<br />
forecast income.<br />
5.65% 3 0.15 5.59% 3 0.15<br />
5.58% 3 0.15<br />
5.58% 3 0.15<br />
Rate of Change in Forecast Surplus<br />
or Deficit<br />
15<br />
Still forecasting an operating surplus<br />
with a movement equal to or less than<br />
3% of forecast income<br />
Forecasting an operating deficit with a<br />
movement less than 2% of forecast<br />
income OR an operating surplus<br />
movement more than 3% of income.<br />
Forecasting an operating deficit with a<br />
movement of greater than 2% of<br />
forecast income.<br />
0.00% 3<br />
0.45<br />
0.00% 3 0.45<br />
0.00% 3 0.45<br />
0.00% 3 0.45<br />
Underlying Position (%)<br />
5<br />
Underlying breakeven or Surplus<br />
An underlying deficit that is less than 2%<br />
of underlying income.<br />
An underlying deficit that is greater than<br />
2% of underlying income<br />
0.43% 3 0.15 0.44% 3<br />
0.15<br />
0.44% 3 0.15<br />
0.44% 3 0.15<br />
Underlying Financial Position<br />
10<br />
EBITDA Margin (%) 5<br />
Underlying EBITDA equal to or greater<br />
than 5% of underlying income<br />
Underlying EBITDA equal to or greater<br />
than 5% but less than 1% of underlying<br />
income<br />
Underlying EBITDA less than 1% of<br />
underlying income<br />
5.65% 3 0.15<br />
5.59% 3 0.15<br />
5.58% 3 0.15<br />
5.58% 3 0.15<br />
Better Payment Practice Code Value<br />
(%)<br />
2.5<br />
95% or more of the value of NHS and<br />
Non NHS bills are paid within 30days<br />
Less than 95% but more than or equal to<br />
Less than 60% of the value of NHS and<br />
60% of the value of NHS and Non NHS<br />
Non NHS bills are paid within 30 days<br />
bills are paid within 30days<br />
77.00% 2 0.05<br />
89.00% 2 0.05<br />
87.00% 2 0.05<br />
85.00% 2 0.05<br />
Better Payment Practice Code<br />
Volume (%) 2.5<br />
95% or more of the volume of NHS and<br />
Non NHS bills are paid within 30days<br />
Less than 95% but more than or equal to<br />
60% of the volume of NHS and Non<br />
NHS bills are paid within 30days<br />
Less than 60% of the volume of NHS<br />
and Non NHS bills are paid within 30<br />
days<br />
83.00%<br />
2 0.05 85.00% 2 0.05<br />
88.00% 2 0.05<br />
88.00% 2 0.05<br />
Finance Processes & Balance<br />
Sheet Efficiency<br />
20<br />
Current Ratio 5<br />
Current Ratio is equal to or greater than<br />
1.<br />
Current ratio is anything less than 1 and<br />
greater than or equal to 0.5<br />
A current ratio of less than 0.5<br />
1.22 3<br />
0.15<br />
1.18 3 0.15<br />
1.16 3 0.15<br />
1.18 3 0.15<br />
Debtor Days 5<br />
Debtor days less than or equal to 30<br />
days<br />
Debtor days greater than 30 and less<br />
than or equal to 60 days<br />
Debtor days greater than 60<br />
12.97<br />
3 0.15 11.79 3 0.15<br />
14.53 3 0.15<br />
13.86 3 0.15<br />
Creditor Days 5 Creditor days less than or equal to 30<br />
Creditor days greater than 30 and less<br />
than or equal to 60 days<br />
Creditor days greater than 60<br />
34.25<br />
2<br />
0.1 37.29 2 0.1<br />
41.48 2 0.1<br />
40.98 2 0.1<br />
*Operating Position = Retained Surplus/Breakeven/deficit less impairments<br />
Weighted Overall Score<br />
2.90 2.90<br />
2.90<br />
2.90<br />
Assessment Thresholds<br />
Performing > 2.40<br />
Performance Under Review 2.10 - 2.40<br />
Underperforming < 2.10