January 2012 - Sandwell & West Birmingham Hospitals
January 2012 - Sandwell & West Birmingham Hospitals
January 2012 - Sandwell & West Birmingham Hospitals

You also want an ePaper? Increase the reach of your titles
YUMPU automatically turns print PDFs into web optimized ePapers that Google loves.
SWBTB (1/12) 286 (a)<br />
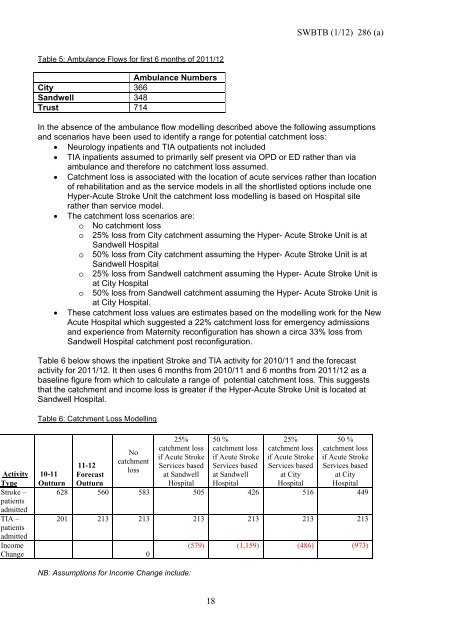
Table 5: Ambulance Flows for first 6 months of 2011/12<br />
Ambulance Numbers<br />
City 366<br />
<strong>Sandwell</strong> 348<br />
Trust 714<br />
In the absence of the ambulance flow modelling described above the following assumptions<br />
and scenarios have been used to identify a range for potential catchment loss:<br />
Neurology inpatients and TIA outpatients not included<br />
TIA inpatients assumed to primarily self present via OPD or ED rather than via<br />
ambulance and therefore no catchment loss assumed.<br />
Catchment loss is associated with the location of acute services rather than location<br />
of rehabilitation and as the service models in all the shortlisted options include one<br />
Hyper-Acute Stroke Unit the catchment loss modelling is based on Hospital site<br />
rather than service model.<br />
The catchment loss scenarios are:<br />
o No catchment loss<br />
o 25% loss from City catchment assuming the Hyper- Acute Stroke Unit is at<br />
<strong>Sandwell</strong> Hospital<br />
o 50% loss from City catchment assuming the Hyper- Acute Stroke Unit is at<br />
<strong>Sandwell</strong> Hospital<br />
o 25% loss from <strong>Sandwell</strong> catchment assuming the Hyper- Acute Stroke Unit is<br />
at City Hospital<br />
o 50% loss from <strong>Sandwell</strong> catchment assuming the Hyper- Acute Stroke Unit is<br />
at City Hospital.<br />
These catchment loss values are estimates based on the modelling work for the New<br />
Acute Hospital which suggested a 22% catchment loss for emergency admissions<br />
and experience from Maternity reconfiguration has shown a circa 33% loss from<br />
<strong>Sandwell</strong> Hospital catchment post reconfiguration.<br />
Table 6 below shows the inpatient Stroke and TIA activity for 2010/11 and the forecast<br />
activity for 2011/12. It then uses 6 months from 2010/11 and 6 months from 2011/12 as a<br />
baseline figure from which to calculate a range of potential catchment loss. This suggests<br />
that the catchment and income loss is greater if the Hyper-Acute Stroke Unit is located at<br />
<strong>Sandwell</strong> Hospital.<br />
Table 6: Catchment Loss Modelling<br />
No<br />
catchment<br />
loss<br />
25%<br />
catchment loss<br />
if Acute Stroke<br />
Services based<br />
at <strong>Sandwell</strong><br />
50 %<br />
catchment loss<br />
if Acute Stroke<br />
Services based<br />
at <strong>Sandwell</strong><br />
25%<br />
catchment loss<br />
if Acute Stroke<br />
Services based<br />
at City<br />
50 %<br />
catchment loss<br />
if Acute Stroke<br />
Services based<br />
at City<br />
11-12<br />
10-11<br />
Outturn<br />
Forecast<br />
Outturn<br />
Hospital Hospital<br />
Hospital Hospital<br />
628 560 583 505 426 516 449<br />
Activity<br />
Type<br />
Stroke –<br />
patients<br />
admitted<br />
TIA –<br />
patients<br />
admitted<br />
Income<br />
Change 0<br />
201 213 213 213 213 213 213<br />
NB: Assumptions for Income Change include:<br />
(579) (1,159) (486) (973)<br />
18