January 2012 - Sandwell & West Birmingham Hospitals
January 2012 - Sandwell & West Birmingham Hospitals
January 2012 - Sandwell & West Birmingham Hospitals

Create successful ePaper yourself
Turn your PDF publications into a flip-book with our unique Google optimized e-Paper software.
SWBTB (1/12) 267 (a)<br />
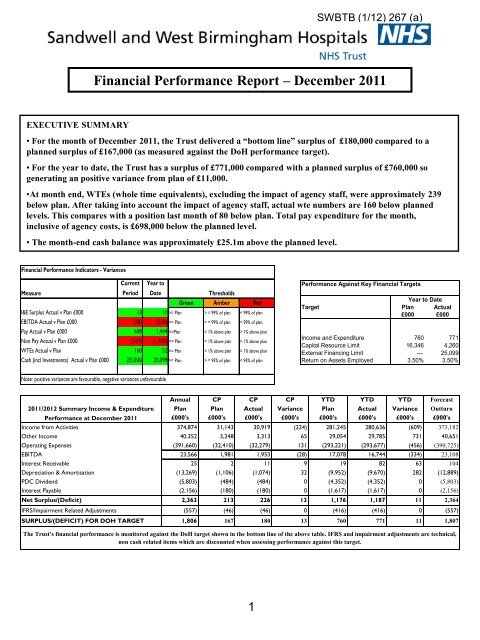
Financial Performance Report – December 2011<br />
EXECUTIVE SUMMARY<br />
• For the month of December 2011, the Trust delivered a “bottom line” surplus of £180,000 compared to a<br />
planned surplus of £167,000 (as measured against the DoH performance target).<br />
• For the year to date, the Trust has a surplus of £771,000 compared with a planned surplus of £760,000 so<br />
generating an positive variance from plan of £11,000.<br />
•At month end, WTEs (whole time equivalents), excluding the impact of agency staff, were approximately 239<br />
below plan. After taking into account the impact of agency staff, actual wte numbers are 160 below planned<br />
levels. This compares with a position last month of 80 below plan. Total pay expenditure for the month,<br />
inclusive of agency costs, is £698,000 below the planned level.<br />
• The month-end cash balance was approximately £25.1m above the planned level.<br />
Financial Performance Indicators - Variances<br />
Measure<br />
Current<br />
Period<br />
Year to<br />
Date<br />
Thresholds<br />
Green Amber Red<br />
I&E Surplus Actual v Plan £000 13 11 >= Plan > = 99% of plan < 99% of plan<br />
EBITDA Actual v Plan £000 (28) (334) >= Plan > = 99% of plan < 99% of plan<br />
Pay Actual v Plan £000 698 1,444 1% above plan<br />
Non Pay Actual v Plan £000 (567) (1,900) 1% above plan<br />
WTEs Actual v Plan 160 52 1% above plan<br />
Cash (incl Investments) Actual v Plan £000 25,099 25,099 >= Plan > = 95% of plan < 95% of plan<br />
Performance Against Key Financial Targets<br />
Year to Date<br />
Target Plan Actual<br />
£000 £000<br />
Income and Expenditure 760 771<br />
Capital Resource Limit 16,346 4,260<br />
External Financing Limit --- 25,099<br />
Return on Assets Employed 3.50% 3.50%<br />
Note: positive variances are favourable, negative variances unfavourable<br />
2011/<strong>2012</strong> Summary Income & Expenditure<br />
Performance at December 2011<br />
Annual CP CP CP YTD YTD YTD Forecast<br />
Plan Plan Actual Variance Plan Actual Variance Outturn<br />
£000's £000's £000's £000's £000's £000's £000's £000's<br />
Income from Activities 374,874 31,143 30,919 (224) 281,245 280,636 (609) 373,182<br />
Other Income 40,352 3,248 3,313 65 29,054 29,785 731 40,651<br />
Operating Expenses (391,660) (32,410) (32,279) 131 (293,221) (293,677) (456) (390,725)<br />
EBITDA 23,566 1,981 1,953 (28) 17,078 16,744 (334) 23,108<br />
Interest Receivable 25 2 11 9 19 82 63 104<br />
Depreciation & Amortisation (13,269) (1,106) (1,074) 32 (9,952) (9,670) 282 (12,889)<br />
PDC Dividend (5,803) (484) (484) 0 (4,352) (4,352) 0 (5,803)<br />
Interest Payable (2,156) (180) (180) 0 (1,617) (1,617) 0 (2,156)<br />
Net Surplus/(Deficit) 2,363 213 226 13 1,176 1,187 11 2,364<br />
IFRS/Impairment Related Adjustments (557) (46) (46) 0 (416) (416) 0 (557)<br />
SURPLUS/(DEFICIT) FOR DOH TARGET 1,806 167 180 13 760 771 11 1,807<br />
The Trust's financial performance is monitored against the DoH target shown in the bottom line of the above table. IFRS and impairment adjustments are technical,<br />
non cash related items which are discounted when assessing performance against this target.<br />
1