January 2012 - Sandwell & West Birmingham Hospitals
January 2012 - Sandwell & West Birmingham Hospitals
January 2012 - Sandwell & West Birmingham Hospitals

You also want an ePaper? Increase the reach of your titles
YUMPU automatically turns print PDFs into web optimized ePapers that Google loves.
SWBTB (1/12) 275 (a)<br />
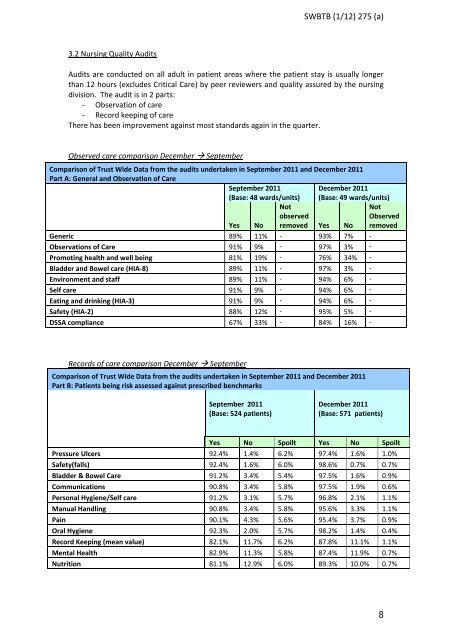
3.2 Nursing Quality Audits<br />
Audits are conducted on all adult in patient areas where the patient stay is usually longer<br />
than 12 hours (excludes Critical Care) by peer reviewers and quality assured by the nursing<br />
division. The audit is in 2 parts:<br />
‐ Observation of care<br />
‐ Record keeping of care<br />
There has been improvement against most standards again in the quarter.<br />
Observed care comparison December September<br />
Comparison of Trust Wide Data from the audits undertaken in September 2011 and December 2011<br />
Part A: General and Observation of Care<br />
September 2011<br />
(Base: 48 wards/units)<br />
Not<br />
observed<br />
December 2011<br />
(Base: 49 wards/units)<br />
Not<br />
Observed<br />
Yes No removed Yes No removed<br />
Generic 89% 11% ‐ 93% 7% ‐<br />
Observations of Care 91% 9% ‐ 97% 3% ‐<br />
Promoting health and well being 81% 19% ‐ 76% 34% ‐<br />
Bladder and Bowel care (HIA‐8) 89% 11% ‐ 97% 3% ‐<br />
Environment and staff 89% 11% ‐ 94% 6% ‐<br />
Self care 91% 9% ‐ 94% 6% ‐<br />
Eating and drinking (HIA‐3) 91% 9% ‐ 94% 6% ‐<br />
Safety (HIA‐2) 88% 12% ‐ 95% 5% ‐<br />
DSSA compliance 67% 33% ‐ 84% 16% ‐<br />
Records of care comparison December September<br />
Comparison of Trust Wide Data from the audits undertaken in September 2011 and December 2011<br />
Part B: Patients being risk assessed against prescribed benchmarks<br />
September 2011<br />
(Base: 524 patients)<br />
December 2011<br />
(Base: 571 patients)<br />
Yes No Spoilt Yes No Spoilt<br />
Pressure Ulcers 92.4% 1.4% 6.2% 97.4% 1.6% 1.0%<br />
Safety(falls) 92.4% 1.6% 6.0% 98.6% 0.7% 0.7%<br />
Bladder & Bowel Care 91.2% 3.4% 5.4% 97.5% 1.6% 0.9%<br />
Communications 90.8% 3.4% 5.8% 97.5% 1.9% 0.6%<br />
Personal Hygiene/Self care 91.2% 3.1% 5.7% 96.8% 2.1% 1.1%<br />
Manual Handling 90.8% 3.4% 5.8% 95.6% 3.3% 1.1%<br />
Pain 90.1% 4.3% 5.6% 95.4% 3.7% 0.9%<br />
Oral Hygiene 92.3% 2.0% 5.7% 98.2% 1.4% 0.4%<br />
Record Keeping (mean value) 82.1% 11.7% 6.2% 87.8% 11.1% 1.1%<br />
Mental Health 82.9% 11.3% 5.8% 87.4% 11.9% 0.7%<br />
Nutrition 81.1% 12.9% 6.0% 89.3% 10.0% 0.7%<br />
8