January 2012 - Sandwell & West Birmingham Hospitals
January 2012 - Sandwell & West Birmingham Hospitals
January 2012 - Sandwell & West Birmingham Hospitals

You also want an ePaper? Increase the reach of your titles
YUMPU automatically turns print PDFs into web optimized ePapers that Google loves.
SWBTB (1/12) 267 (a)<br />
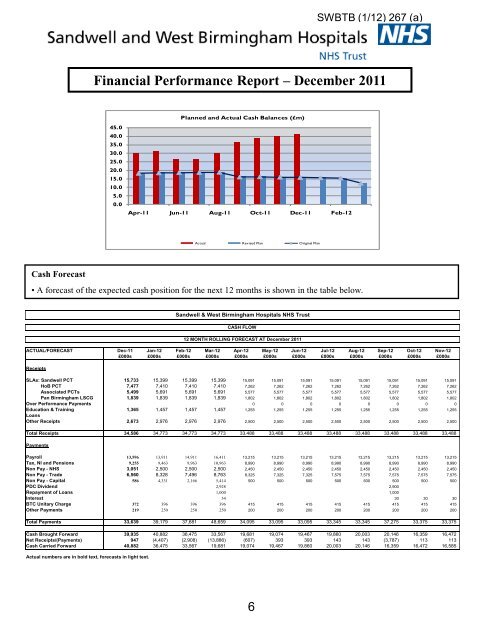
Financial Performance Report – December 2011<br />
45.0<br />
40.0<br />
35.0<br />
30.0<br />
25.0<br />
20.0<br />
15.0<br />
10.0<br />
5.0<br />
0.0<br />
Planned and Actual Cash Balances (£m)<br />
Apr-11 Jun-11 Aug-11 Oct-11 Dec-11 Feb-12<br />
Actual Revised Plan Original Plan<br />
Cash Forecast<br />
• A forecast of the expected cash position for the next 12 months is shown in the table below.<br />
ACTUAL/FORECAST Dec-11 Jan-12 Feb-12 Mar-12 Apr-12 May-12 Jun-12 Jul-12 Aug-12 Sep-12 Oct-12 Nov-12<br />
£000s £000s £000s £000s £000s £000s £000s £000s £000s £000s £000s £000s<br />
Receipts<br />
<strong>Sandwell</strong> & <strong>West</strong> <strong>Birmingham</strong> <strong>Hospitals</strong> NHS Trust<br />
CASH FLOW<br />
12 MONTH ROLLING FORECAST AT December 2011<br />
SLAs: <strong>Sandwell</strong> PCT 15,733 15,399 15,399 15,399 15,091 15,091 15,091 15,091 15,091 15,091 15,091 15,091<br />
HoB PCT 7,477 7,410 7,410 7,410 7,262 7,262 7,262 7,262 7,262 7,262 7,262 7,262<br />
Associated PCTs 5,499 5,691 5,691 5,691 5,577 5,577 5,577 5,577 5,577 5,577 5,577 5,577<br />
Pan <strong>Birmingham</strong> LSCG 1,839 1,839 1,839 1,839 1,802 1,802 1,802 1,802 1,802 1,802 1,802 1,802<br />
Over Performance Payments 0 0 0 0 0 0 0 0<br />
Education & Training 1,365 1,457 1,457 1,457 1,255 1,255 1,255 1,255 1,255 1,255 1,255 1,255<br />
Loans<br />
Other Receipts 2,673 2,976 2,976 2,976 2,500 2,500 2,500 2,500 2,500 2,500 2,500 2,500<br />
Total Receipts 34,586 34,773 34,773 34,773 33,488 33,488 33,488 33,488 33,488 33,488 33,488 33,488<br />
Payments<br />
Payroll 13,596 13,911 14,911 16,411 13,215 13,215 13,215 13,215 13,215 13,215 13,215 13,215<br />
Tax, NI and Pensions 9,255 9,463 9,963 10,963 8,990 8,990 8,990 8,990 8,990 8,990 8,990 8,990<br />
Non Pay - NHS 3,051 2,500 2,500 2,500 2,450 2,450 2,450 2,450 2,450 2,450 2,450 2,450<br />
Non Pay - Trade 6,560 8,328 7,496 8,763 8,325 7,325 7,325 7,575 7,575 7,575 7,575 7,575<br />
Non Pay - Capital 586 4,331 2,166 5,414 500 500 500 500 500 500 500 500<br />
PDC Dividend 2,928 2,900<br />
Repayment of Loans 1,000 1,000<br />
Interest 34 30 30 30<br />
BTC Unitary Charge 372 396 396 396 415 415 415 415 415 415 415 415<br />
Other Payments 219 250 250 250 200 200 200 200 200 200 200 200<br />
Total Payments 33,639 39,179 37,681 48,659 34,095 33,095 33,095 33,345 33,345 37,275 33,375 33,375<br />
Cash Brought Forward 39,935 40,882 36,475 33,567 19,681 19,074 19,467 19,860 20,003 20,146 16,359 16,472<br />
Net Receipts/(Payments) 947 (4,407) (2,908) (13,886) (607) 393 393 143 143 (3,787) 113 113<br />
Cash Carried Forward 40,882 36,475 33,567 19,681 19,074 19,467 19,860 20,003 20,146 16,359 16,472 16,585<br />
Actual numbers are in bold text, forecasts in light text.<br />
6