

Application and Optimisation of the Spatial Phase Shifting ...
Application and Optimisation of the Spatial Phase Shifting ...
Application and Optimisation of the Spatial Phase Shifting ...

You also want an ePaper? Increase the reach of your titles
YUMPU automatically turns print PDFs into web optimized ePapers that Google loves.
114 Comparison <strong>of</strong> noise in phase maps from TPS <strong>and</strong> SPS<br />
within 5% when this technique was used. The subtraction method is known as „dark frame“ calibration<br />
method [Che85]. Note here that both SPS <strong>and</strong> TPS are implemented as integrating-bucket versions.<br />
5.2 Preliminary investigations<br />
To obtain <strong>the</strong> best performance for both <strong>of</strong> <strong>the</strong> methods, some experimental parameters have to be fixed.<br />
These are <strong>the</strong> phase shift to work with <strong>and</strong> <strong>the</strong> optimal reference-to-object intensity ratio. The latter will<br />
be treated in Chapter 6.1.1 in a wider context; for now, let us retain that <strong>the</strong> st<strong>and</strong>ard beam ratio B=R /O<br />
is 10:1 in this chapter. Also, it is important to get to know <strong>the</strong> test object <strong>and</strong> to assess <strong>the</strong> reliability <strong>of</strong> <strong>the</strong><br />
results. The preliminary steps are briefly described below.<br />
5.2.1 Choice <strong>of</strong> phase shift<br />
Since it is essential for light efficiency to keep <strong>the</strong> speckles as small as possible, <strong>the</strong> number <strong>of</strong> phase<br />
sampling points for SPS is restricted to <strong>the</strong> minimum, which is three (see Chapter 3.2). Therefore, we use<br />
a three-phase formula also in TPS. For this number <strong>of</strong> samples, <strong>the</strong> two common values for <strong>the</strong> phase shift<br />
to choose from are α=90° or α=120°. Theoretical results [Cre88, Sur97a] suggest that for TPS, 120°<br />
should be <strong>the</strong> better choice. For SPS however, <strong>the</strong> findings <strong>of</strong> Chapter 3.2.2 indicate an advantage for<br />
α=90°. The error quantification established in Chapter 4.2 now allows us to check <strong>the</strong>se presumptions<br />
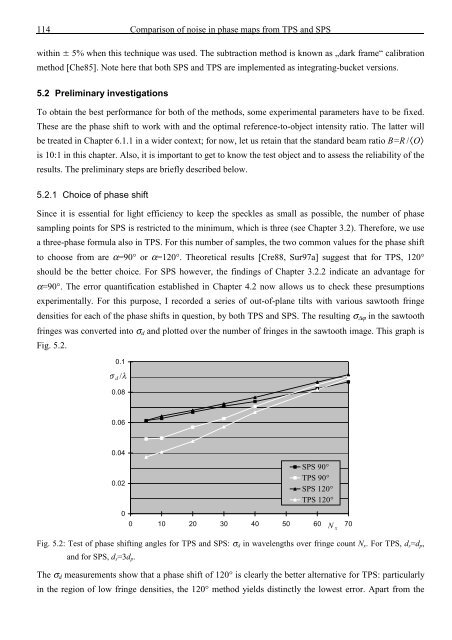
experimentally. For this purpose, I recorded a series <strong>of</strong> out-<strong>of</strong>-plane tilts with various sawtooth fringe<br />
densities for each <strong>of</strong> <strong>the</strong> phase shifts in question, by both TPS <strong>and</strong> SPS. The resulting σ ∆ϕ in <strong>the</strong> sawtooth<br />
fringes was converted into σ d <strong>and</strong> plotted over <strong>the</strong> number <strong>of</strong> fringes in <strong>the</strong> sawtooth image. This graph is<br />
Fig. 5.2.<br />
0.1<br />
σ d /λ<br />
0.08<br />
0.06<br />
0.04<br />
0.02<br />
0<br />
SPS 90°<br />
TPS 90°<br />
SPS 120°<br />
TPS 120°<br />
0 10 20 30 40 50 60 70 N x<br />
Fig. 5.2: Test <strong>of</strong> phase shifting angles for TPS <strong>and</strong> SPS: σ d in wavelengths over fringe count N x . For TPS, d s =d p ,<br />
<strong>and</strong> for SPS, d s =3d p .<br />
The σ d measurements show that a phase shift <strong>of</strong> 120° is clearly <strong>the</strong> better alternative for TPS: particularly<br />
in <strong>the</strong> region <strong>of</strong> low fringe densities, <strong>the</strong> 120° method yields distinctly <strong>the</strong> lowest error. Apart from <strong>the</strong>


![Skript zur Vorlesung [PDF; 40,0MB ;25.07.2005] - Institut für Physik](https://img.yumpu.com/28425341/1/184x260/skript-zur-vorlesung-pdf-400mb-25072005-institut-fa-1-4-r-physik.jpg?quality=85)


