

Application and Optimisation of the Spatial Phase Shifting ...
Application and Optimisation of the Spatial Phase Shifting ...
Application and Optimisation of the Spatial Phase Shifting ...

Create successful ePaper yourself
Turn your PDF publications into a flip-book with our unique Google optimized e-Paper software.
76 Electronic or Digital Speckle Pattern Interferometry<br />
whenever <strong>the</strong> integration interval is symmetrical. The static method is referred to as <strong>the</strong> step method <strong>and</strong><br />
<strong>the</strong> dynamically phase shifting approach is known as integrating-bucket or simply bucket method<br />
[Wya75].<br />
The equation system (3.12) or (3.59) is set up under <strong>the</strong> assumption that <strong>the</strong> unknowns do not change<br />
from frame to frame, i.e. are temporally constant. While this is very likely to be correct for I b <strong>and</strong> M I , it is<br />
difficult to assure for ϕ O , which is why vibration-isolating optical tables, phase stabilisation facilities<br />
<strong>and</strong>/or short exposure times are very common with this method. The interferograms I n (x,y,t n ) must be<br />
recorded as quickly as possible to diminish influences by object changes or phase fluctuations in <strong>the</strong><br />
interferometer, <strong>and</strong> <strong>the</strong> possibilities to carry out TPS measurements <strong>of</strong> rapidly moving objects or under<br />
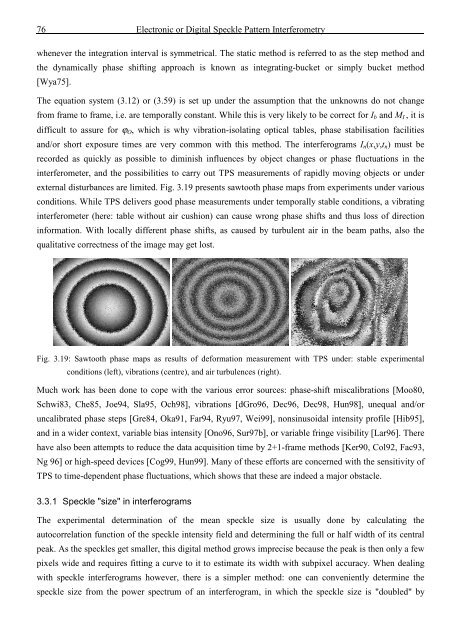
external disturbances are limited. Fig. 3.19 presents sawtooth phase maps from experiments under various<br />
conditions. While TPS delivers good phase measurements under temporally stable conditions, a vibrating<br />
interferometer (here: table without air cushion) can cause wrong phase shifts <strong>and</strong> thus loss <strong>of</strong> direction<br />
information. With locally different phase shifts, as caused by turbulent air in <strong>the</strong> beam paths, also <strong>the</strong><br />
qualitative correctness <strong>of</strong> <strong>the</strong> image may get lost.<br />
Fig. 3.19: Sawtooth phase maps as results <strong>of</strong> deformation measurement with TPS under: stable experimental<br />
conditions (left), vibrations (centre), <strong>and</strong> air turbulences (right).<br />
Much work has been done to cope with <strong>the</strong> various error sources: phase-shift miscalibrations [Moo80,<br />
Schwi83, Che85, Joe94, Sla95, Och98], vibrations [dGro96, Dec96, Dec98, Hun98], unequal <strong>and</strong>/or<br />
uncalibrated phase steps [Gre84, Oka91, Far94, Ryu97, Wei99], nonsinusoidal intensity pr<strong>of</strong>ile [Hib95],<br />
<strong>and</strong> in a wider context, variable bias intensity [Ono96, Sur97b], or variable fringe visibility [Lar96]. There<br />
have also been attempts to reduce <strong>the</strong> data acquisition time by 2+1-frame methods [Ker90, Col92, Fac93,<br />
Ng 96] or high-speed devices [Cog99, Hun99]. Many <strong>of</strong> <strong>the</strong>se efforts are concerned with <strong>the</strong> sensitivity <strong>of</strong><br />
TPS to time-dependent phase fluctuations, which shows that <strong>the</strong>se are indeed a major obstacle.<br />
3.3.1 Speckle "size" in interferograms<br />
The experimental determination <strong>of</strong> <strong>the</strong> mean speckle size is usually done by calculating <strong>the</strong><br />
autocorrelation function <strong>of</strong> <strong>the</strong> speckle intensity field <strong>and</strong> determining <strong>the</strong> full or half width <strong>of</strong> its central<br />
peak. As <strong>the</strong> speckles get smaller, this digital method grows imprecise because <strong>the</strong> peak is <strong>the</strong>n only a few<br />
pixels wide <strong>and</strong> requires fitting a curve to it to estimate its width with subpixel accuracy. When dealing<br />
with speckle interferograms however, <strong>the</strong>re is a simpler method: one can conveniently determine <strong>the</strong><br />
speckle size from <strong>the</strong> power spectrum <strong>of</strong> an interferogram, in which <strong>the</strong> speckle size is "doubled" by


![Skript zur Vorlesung [PDF; 40,0MB ;25.07.2005] - Institut für Physik](https://img.yumpu.com/28425341/1/184x260/skript-zur-vorlesung-pdf-400mb-25072005-institut-fa-1-4-r-physik.jpg?quality=85)


