Application and Optimisation of the Spatial Phase Shifting ...
Application and Optimisation of the Spatial Phase Shifting ...
Application and Optimisation of the Spatial Phase Shifting ...
You also want an ePaper? Increase the reach of your titles
YUMPU automatically turns print PDFs into web optimized ePapers that Google loves.
134 Improvements on SPS<br />
intensity on adjacent pixels (x,y) <strong>and</strong> (x1,y), σ O0 ,O 1<br />
, <strong>and</strong> <strong>of</strong> that <strong>of</strong> <strong>the</strong> imaging system's electronic<br />
noise, σ e . * Hence we rewrite (6.1) as<br />
σ<br />
σ<br />
2 O O + σ<br />
2<br />
0,<br />
± 1 e<br />
ϕ O<br />
≅<br />
2 ⋅<br />
O<br />
⋅ R<br />
⋅<br />
8<br />
3<br />
. (6.2)<br />
In a speckle field, σ O0,O 1<br />
depends on <strong>the</strong> degree <strong>of</strong> spatial coherence [Goo75], µ A (x 0 , x 1 ), <strong>of</strong> <strong>the</strong> points<br />
(k,l) <strong>and</strong> (k1,l). For a circular aperture <strong>and</strong> d s = 3d p , we find µ A (x 0 , x 1 ) 0.81. Moreover, σ O0,O 1<br />
is<br />
conditioned on O 0 , which relationship is analytically known [Don79]. We can generalise (2.52) to read<br />
( O )<br />
2 2<br />
0 ± 1<br />
2 2 2 2<br />
σ O , O = ( 1− µ A ) + 2 O µ A ( 1− µ A ) , (6.3)<br />
<strong>and</strong> inserting (6.3) into (6.2), we can calculate σϕ O<br />
, which is <strong>the</strong> same for both object states:<br />
σϕ O =σϕ O,i =σϕ O,f<br />
. For <strong>the</strong> phase difference ∆ϕ =ϕ O,f–ϕ O,i we <strong>the</strong>refore get σ ∆ ϕ = L2σϕ O<br />
<strong>and</strong> from this <strong>the</strong><br />
corresponding quantity for <strong>the</strong> displacement, σ d , as a function <strong>of</strong> <strong>the</strong> beam ratio B = R/〈O〉. These data can<br />
be compared with <strong>the</strong> experimental results.<br />
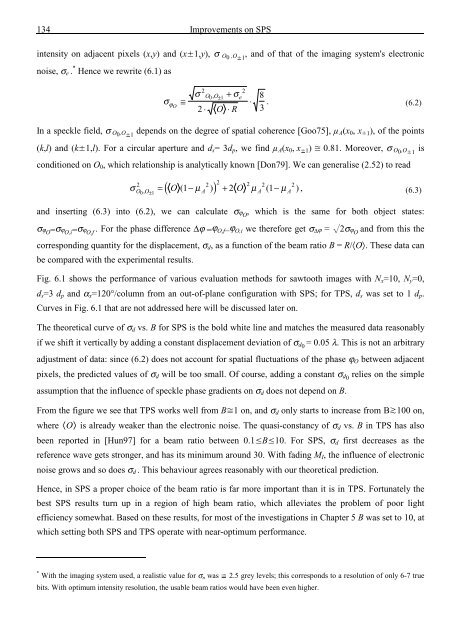
Fig. 6.1 shows <strong>the</strong> performance <strong>of</strong> various evaluation methods for sawtooth images with N x =10, N y =0,<br />
d s =3 d p <strong>and</strong> α x =120°/column from an out-<strong>of</strong>-plane configuration with SPS; for TPS, d s was set to 1 d p .<br />
Curves in Fig. 6.1 that are not addressed here will be discussed later on.<br />
The <strong>the</strong>oretical curve <strong>of</strong> σ d vs. B for SPS is <strong>the</strong> bold white line <strong>and</strong> matches <strong>the</strong> measured data reasonably<br />
if we shift it vertically by adding a constant displacement deviation <strong>of</strong> σ d 0<br />
= 0.05 λ. This is not an arbitrary<br />
adjustment <strong>of</strong> data: since (6.2) does not account for spatial fluctuations <strong>of</strong> <strong>the</strong> phase ϕ O between adjacent<br />
pixels, <strong>the</strong> predicted values <strong>of</strong> σ d will be too small. Of course, adding a constant σ d 0<br />
relies on <strong>the</strong> simple<br />
assumption that <strong>the</strong> influence <strong>of</strong> speckle phase gradients on σ d does not depend on B.<br />
From <strong>the</strong> figure we see that TPS works well from B1 on, <strong>and</strong> σ d only starts to increase from B100 on,<br />
where O is already weaker than <strong>the</strong> electronic noise. The quasi-constancy <strong>of</strong> σ d vs. B in TPS has also<br />
been reported in [Hun97] for a beam ratio between 0.1B10. For SPS, σ d first decreases as <strong>the</strong><br />
reference wave gets stronger, <strong>and</strong> has its minimum around 30. With fading M I , <strong>the</strong> influence <strong>of</strong> electronic<br />
noise grows <strong>and</strong> so does σ d . This behaviour agrees reasonably with our <strong>the</strong>oretical prediction.<br />
Hence, in SPS a proper choice <strong>of</strong> <strong>the</strong> beam ratio is far more important than it is in TPS. Fortunately <strong>the</strong><br />
best SPS results turn up in a region <strong>of</strong> high beam ratio, which alleviates <strong>the</strong> problem <strong>of</strong> poor light<br />
efficiency somewhat. Based on <strong>the</strong>se results, for most <strong>of</strong> <strong>the</strong> investigations in Chapter 5 B was set to 10, at<br />
which setting both SPS <strong>and</strong> TPS operate with near-optimum performance.<br />
* With <strong>the</strong> imaging system used, a realistic value for σ n was ¡ 2.5 grey levels; this corresponds to a resolution <strong>of</strong> only 6-7 true<br />
bits. With optimum intensity resolution, <strong>the</strong> usable beam ratios would have been even higher.








![Skript zur Vorlesung [PDF; 40,0MB ;25.07.2005] - Institut für Physik](https://img.yumpu.com/28425341/1/184x260/skript-zur-vorlesung-pdf-400mb-25072005-institut-fa-1-4-r-physik.jpg?quality=85)
