Application and Optimisation of the Spatial Phase Shifting ...
Application and Optimisation of the Spatial Phase Shifting ...
Application and Optimisation of the Spatial Phase Shifting ...
Create successful ePaper yourself
Turn your PDF publications into a flip-book with our unique Google optimized e-Paper software.
6.2 Modified phase reconstruction formulae 141<br />
temporal resolution in o<strong>the</strong>r measurements. Moreover, (6.4) assumes R <strong>and</strong> O to be fully interferent,<br />
which is not <strong>the</strong> case when depolarising objects are being tested. In this case, one must accept that <strong>the</strong><br />
treatment overestimates M I (which is related to <strong>the</strong> square roots), or re-polarise <strong>the</strong> waves appropriately.<br />
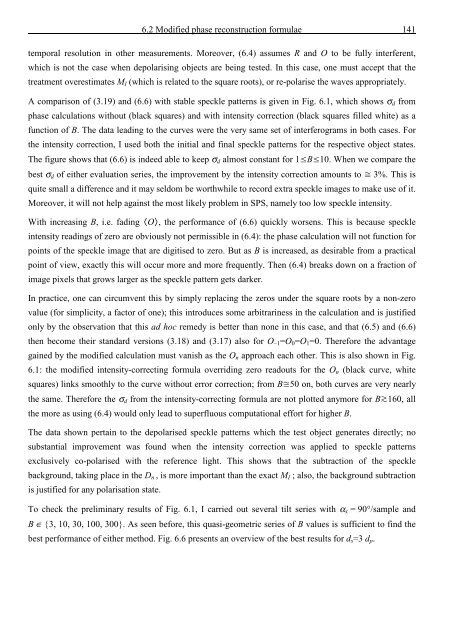
A comparison <strong>of</strong> (3.19) <strong>and</strong> (6.6) with stable speckle patterns is given in Fig. 6.1, which shows σ d from<br />
phase calculations without (black squares) <strong>and</strong> with intensity correction (black squares filled white) as a<br />
function <strong>of</strong> B. The data leading to <strong>the</strong> curves were <strong>the</strong> very same set <strong>of</strong> interferograms in both cases. For<br />
<strong>the</strong> intensity correction, I used both <strong>the</strong> initial <strong>and</strong> final speckle patterns for <strong>the</strong> respective object states.<br />
The figure shows that (6.6) is indeed able to keep σ d almost constant for 1B10. When we compare <strong>the</strong><br />
best σ d <strong>of</strong> ei<strong>the</strong>r evaluation series, <strong>the</strong> improvement by <strong>the</strong> intensity correction amounts to 3%. This is<br />
quite small a difference <strong>and</strong> it may seldom be worthwhile to record extra speckle images to make use <strong>of</strong> it.<br />
Moreover, it will not help against <strong>the</strong> most likely problem in SPS, namely too low speckle intensity.<br />
With increasing B, i.e. fading O, <strong>the</strong> performance <strong>of</strong> (6.6) quickly worsens. This is because speckle<br />
intensity readings <strong>of</strong> zero are obviously not permissible in (6.4): <strong>the</strong> phase calculation will not function for<br />
points <strong>of</strong> <strong>the</strong> speckle image that are digitised to zero. But as B is increased, as desirable from a practical<br />
point <strong>of</strong> view, exactly this will occur more <strong>and</strong> more frequently. Then (6.4) breaks down on a fraction <strong>of</strong><br />
image pixels that grows larger as <strong>the</strong> speckle pattern gets darker.<br />
In practice, one can circumvent this by simply replacing <strong>the</strong> zeros under <strong>the</strong> square roots by a non-zero<br />
value (for simplicity, a factor <strong>of</strong> one); this introduces some arbitrariness in <strong>the</strong> calculation <strong>and</strong> is justified<br />
only by <strong>the</strong> observation that this ad hoc remedy is better than none in this case, <strong>and</strong> that (6.5) <strong>and</strong> (6.6)<br />
<strong>the</strong>n become <strong>the</strong>ir st<strong>and</strong>ard versions (3.18) <strong>and</strong> (3.17) also for O –1 =O 0 =O 1 =0. Therefore <strong>the</strong> advantage<br />
gained by <strong>the</strong> modified calculation must vanish as <strong>the</strong> O n approach each o<strong>the</strong>r. This is also shown in Fig.<br />
6.1: <strong>the</strong> modified intensity-correcting formula overriding zero readouts for <strong>the</strong> O n (black curve, white<br />
squares) links smoothly to <strong>the</strong> curve without error correction; from B50 on, both curves are very nearly<br />
<strong>the</strong> same. Therefore <strong>the</strong> σ d from <strong>the</strong> intensity-correcting formula are not plotted anymore for B160, all<br />
<strong>the</strong> more as using (6.4) would only lead to superfluous computational effort for higher B.<br />
The data shown pertain to <strong>the</strong> depolarised speckle patterns which <strong>the</strong> test object generates directly; no<br />
substantial improvement was found when <strong>the</strong> intensity correction was applied to speckle patterns<br />
exclusively co-polarised with <strong>the</strong> reference light. This shows that <strong>the</strong> subtraction <strong>of</strong> <strong>the</strong> speckle<br />
background, taking place in <strong>the</strong> D n , is more important than <strong>the</strong> exact M I ; also, <strong>the</strong> background subtraction<br />
is justified for any polarisation state.<br />
To check <strong>the</strong> preliminary results <strong>of</strong> Fig. 6.1, I carried out several tilt series with α x = 90°/sample <strong>and</strong><br />
B ∈ {3, 10, 30, 100, 300}. As seen before, this quasi-geometric series <strong>of</strong> B values is sufficient to find <strong>the</strong><br />
best performance <strong>of</strong> ei<strong>the</strong>r method. Fig. 6.6 presents an overview <strong>of</strong> <strong>the</strong> best results for d s =3 d p .








![Skript zur Vorlesung [PDF; 40,0MB ;25.07.2005] - Institut für Physik](https://img.yumpu.com/28425341/1/184x260/skript-zur-vorlesung-pdf-400mb-25072005-institut-fa-1-4-r-physik.jpg?quality=85)
