

Application and Optimisation of the Spatial Phase Shifting ...
Application and Optimisation of the Spatial Phase Shifting ...
Application and Optimisation of the Spatial Phase Shifting ...

You also want an ePaper? Increase the reach of your titles
YUMPU automatically turns print PDFs into web optimized ePapers that Google loves.
2.2 First-order speckle statistics 25<br />
Apart from statistical considerations, a very simple explanation <strong>of</strong> <strong>the</strong> phenomenon is <strong>the</strong> phasor<br />
interpretation suggested in [Bur98a, Leh98] <strong>and</strong> shown in Fig. 2.13.<br />
A i<br />
A i<br />
A p (∆x, ∆y)<br />
A p (∆x, ∆y)<br />
A 2 (x 2 ,y 2 )<br />
A 2 (x 2 ,y 2 )<br />
A 1 (x 1 ,y 1 )<br />
A 1 (x 1 ,y 1 )<br />
ϕ 2 (x 2 ,y 2 )<br />
ϕ 1 (x 1 ,y 1 )<br />
A r<br />
ϕ 2 (x 2 ,y 2 )<br />
ϕ 1 (x 1 ,y 1 )<br />
A r<br />
Fig. 2.13: Variation <strong>of</strong> a speckle phasor A 1 due to a perturbation A p for different amplitudes A 1 (x 1, y 1 ) . ϕ 1 (x 1, y 1 )<br />
<strong>and</strong> A p (∆x, ∆y) are <strong>the</strong> same in both cases.<br />
If a phasor A 1 (x 1, y 1 ) undergoes a change A p (∆x, ∆y) while we move from (x 1, y 1 ) to (x 2, y 2 ) in <strong>the</strong> speckle<br />
field, <strong>the</strong>n <strong>the</strong> phase change will greatly depend on <strong>the</strong> length <strong>of</strong> A 1 (x 1, y 1 ). In <strong>the</strong> sketch to <strong>the</strong> left, <strong>the</strong><br />
phase ϕ changes considerably on <strong>the</strong> way from (x 1, y 1 ) to (x 2, y 2 ), since FA 1 (x 1, y 1 )F is relatively small. The<br />
drawing to <strong>the</strong> right demonstrates <strong>the</strong> higher stability <strong>of</strong> brighter regions against changes: when FA 1 (x 2, y 2 )F<br />
is large, <strong>the</strong> same A p (∆x, ∆y) leads to a distinctly smaller phase change. This is valid for all arguments <strong>of</strong><br />
A p except ϕ 1 . Unfortunately, this model is not suitable to underst<strong>and</strong> <strong>the</strong> correlation <strong>of</strong> intensity <strong>and</strong><br />
intensity gradients. To conclude with, Fig. 2.14 gives an impression <strong>of</strong> <strong>the</strong> relation between intensities <strong>and</strong><br />
phases in <strong>the</strong> sample speckle field.<br />
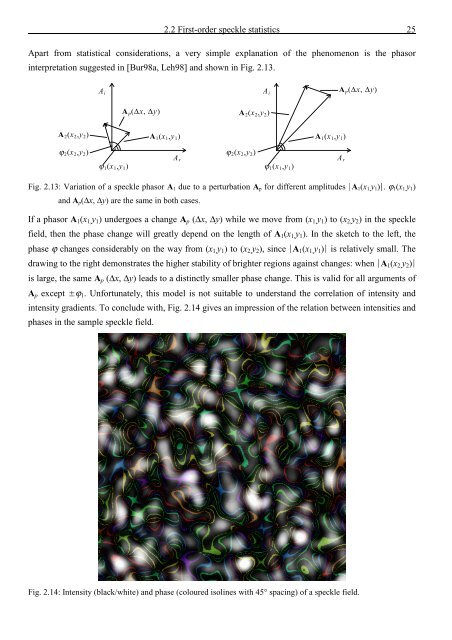
Fig. 2.14: Intensity (black/white) <strong>and</strong> phase (coloured isolines with 45° spacing) <strong>of</strong> a speckle field.


![Skript zur Vorlesung [PDF; 40,0MB ;25.07.2005] - Institut für Physik](https://img.yumpu.com/28425341/1/184x260/skript-zur-vorlesung-pdf-400mb-25072005-institut-fa-1-4-r-physik.jpg?quality=85)


