

Application and Optimisation of the Spatial Phase Shifting ...
Application and Optimisation of the Spatial Phase Shifting ...
Application and Optimisation of the Spatial Phase Shifting ...

You also want an ePaper? Increase the reach of your titles
YUMPU automatically turns print PDFs into web optimized ePapers that Google loves.
130 Comparison <strong>of</strong> noise in phase maps from TPS <strong>and</strong> SPS<br />
number <strong>of</strong> samples <strong>and</strong> not α x ). The corresponding elliptical aperture shape was indicated in Fig. 5.1; its<br />
area, <strong>and</strong> hence <strong>the</strong> object intensity it transmits, is three times that <strong>of</strong> <strong>the</strong> circular aperture.<br />
I 0 I 1<br />
I 2<br />
I 0 I 1 I 2<br />
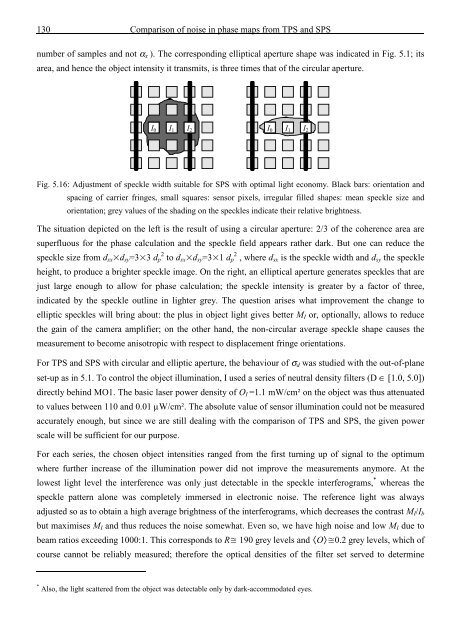
Fig. 5.16: Adjustment <strong>of</strong> speckle width suitable for SPS with optimal light economy. Black bars: orientation <strong>and</strong><br />
spacing <strong>of</strong> carrier fringes, small squares: sensor pixels, irregular filled shapes: mean speckle size <strong>and</strong><br />
orientation; grey values <strong>of</strong> <strong>the</strong> shading on <strong>the</strong> speckles indicate <strong>the</strong>ir relative brightness.<br />
The situation depicted on <strong>the</strong> left is <strong>the</strong> result <strong>of</strong> using a circular aperture: 2/3 <strong>of</strong> <strong>the</strong> coherence area are<br />
superfluous for <strong>the</strong> phase calculation <strong>and</strong> <strong>the</strong> speckle field appears ra<strong>the</strong>r dark. But one can reduce <strong>the</strong><br />
speckle size from d sx d sy =33 d 2 p to d sx d sy =31 d 2 p , where d sx is <strong>the</strong> speckle width <strong>and</strong> d sy <strong>the</strong> speckle<br />
height, to produce a brighter speckle image. On <strong>the</strong> right, an elliptical aperture generates speckles that are<br />
just large enough to allow for phase calculation; <strong>the</strong> speckle intensity is greater by a factor <strong>of</strong> three,<br />
indicated by <strong>the</strong> speckle outline in lighter grey. The question arises what improvement <strong>the</strong> change to<br />
elliptic speckles will bring about: <strong>the</strong> plus in object light gives better M I or, optionally, allows to reduce<br />
<strong>the</strong> gain <strong>of</strong> <strong>the</strong> camera amplifier; on <strong>the</strong> o<strong>the</strong>r h<strong>and</strong>, <strong>the</strong> non-circular average speckle shape causes <strong>the</strong><br />
measurement to become anisotropic with respect to displacement fringe orientations.<br />
For TPS <strong>and</strong> SPS with circular <strong>and</strong> elliptic aperture, <strong>the</strong> behaviour <strong>of</strong> σ d was studied with <strong>the</strong> out-<strong>of</strong>-plane<br />
set-up as in 5.1. To control <strong>the</strong> object illumination, I used a series <strong>of</strong> neutral density filters (D ∈ [1.0, 5.0])<br />
directly behind MO1. The basic laser power density <strong>of</strong> O I =1.1 mW/cm² on <strong>the</strong> object was thus attenuated<br />
to values between 110 <strong>and</strong> 0.01 µW/cm². The absolute value <strong>of</strong> sensor illumination could not be measured<br />
accurately enough, but since we are still dealing with <strong>the</strong> comparison <strong>of</strong> TPS <strong>and</strong> SPS, <strong>the</strong> given power<br />
scale will be sufficient for our purpose.<br />
For each series, <strong>the</strong> chosen object intensities ranged from <strong>the</strong> first turning up <strong>of</strong> signal to <strong>the</strong> optimum<br />
where fur<strong>the</strong>r increase <strong>of</strong> <strong>the</strong> illumination power did not improve <strong>the</strong> measurements anymore. At <strong>the</strong><br />
lowest light level <strong>the</strong> interference was only just detectable in <strong>the</strong> speckle interferograms, * whereas <strong>the</strong><br />
speckle pattern alone was completely immersed in electronic noise. The reference light was always<br />
adjusted so as to obtain a high average brightness <strong>of</strong> <strong>the</strong> interferograms, which decreases <strong>the</strong> contrast M I /I b<br />
but maximises M I <strong>and</strong> thus reduces <strong>the</strong> noise somewhat. Even so, we have high noise <strong>and</strong> low M I due to<br />
beam ratios exceeding 1000:1. This corresponds to R 190 grey levels <strong>and</strong> O0.2 grey levels, which <strong>of</strong><br />
course cannot be reliably measured; <strong>the</strong>refore <strong>the</strong> optical densities <strong>of</strong> <strong>the</strong> filter set served to determine<br />
* Also, <strong>the</strong> light scattered from <strong>the</strong> object was detectable only by dark-accommodated eyes.


![Skript zur Vorlesung [PDF; 40,0MB ;25.07.2005] - Institut für Physik](https://img.yumpu.com/28425341/1/184x260/skript-zur-vorlesung-pdf-400mb-25072005-institut-fa-1-4-r-physik.jpg?quality=85)


