Application and Optimisation of the Spatial Phase Shifting ...
Application and Optimisation of the Spatial Phase Shifting ...
Application and Optimisation of the Spatial Phase Shifting ...
You also want an ePaper? Increase the reach of your titles
YUMPU automatically turns print PDFs into web optimized ePapers that Google loves.
3.2 <strong>Phase</strong>-shifting ESPI 55<br />
α n =α(t n ), to obtain a temporal sequence <strong>of</strong> phase-shifted interferograms I n (x, y, t n ); but once we have<br />
clarified <strong>the</strong> different methods, <strong>the</strong> transfer to spatial phase shifting is very simple.<br />
3.2.1.1 <strong>Phase</strong>-<strong>of</strong>-differences method<br />
The first approach to think <strong>of</strong> when processing secondary interferograms is to determine <strong>the</strong>ir phases as<br />
familiar from primary interferometric fringes. Given a set <strong>of</strong> images I n,i <strong>of</strong> <strong>the</strong> initial object state, one <strong>the</strong>n<br />
needs only one frame I 0 , f <strong>of</strong> <strong>the</strong> final state, so four or five images are sufficient to use <strong>the</strong> phase-shifting<br />
methods <strong>of</strong> (3.16) or (3.17), respectively. As only one frame <strong>of</strong> <strong>the</strong> final object state is involved, we shall<br />
call <strong>the</strong> I n,i plus I 0 , f a "reduced" data set. The phase-shifted secondary correlation fringes I n,c are formed<br />
according to<br />
( )<br />
I = I − I<br />
n, c f n,<br />
i<br />
2<br />
( cos( ϕ ∆ϕ) cos( ϕ α ))<br />
= 4OR<br />
+ − +<br />
O O n<br />
2 ⎛ ∆ϕ + αn<br />
⎞ 2 ⎛ ∆ϕ − αn<br />
⎞<br />
= 16ORsin<br />
⎜ϕO<br />
+ ⎟ sin ⎜ ⎟<br />
⎝ 2 ⎠ ⎝ 2 ⎠<br />
= 4OR( 1− cos( 2ϕO + ∆ϕ + αn ))( 1− cos( ∆ ϕ −αn<br />
)) ,<br />
2<br />
(3.20)<br />
where <strong>the</strong> first cosine describes <strong>the</strong> speckle noise in <strong>the</strong> correlation fringes <strong>and</strong> <strong>the</strong> second cosine is <strong>the</strong><br />
envelope, phase shifted by α n . This approach <strong>of</strong>fers one significant advantage: if <strong>the</strong> object under test can<br />
initially be observed at rest, <strong>the</strong> capturing <strong>of</strong> one interferogram suffices later on to obtain phase-shifted<br />
correlation fringes.<br />
There is ano<strong>the</strong>r important consequence <strong>of</strong> (3.20) that has, as far as I know, not been emphasised before:<br />
<strong>the</strong> first cosine depends on 2ϕ O . This is <strong>of</strong> course owing to <strong>the</strong> squaring operation – <strong>and</strong> would not look<br />
very different if we were dealing with <strong>the</strong> modulus –, but it means that we cannot distinguish between<br />
positive <strong>and</strong> negative speckle intensity changes anymore. Thus, half <strong>the</strong> information delivered by <strong>the</strong><br />
intensity changes is discarded, with important consequences for <strong>the</strong> measured ∆ϕ. The situation is<br />
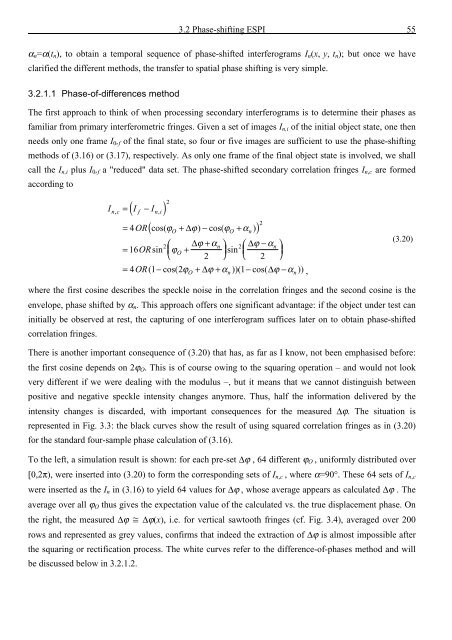
represented in Fig. 3.3: <strong>the</strong> black curves show <strong>the</strong> result <strong>of</strong> using squared correlation fringes as in (3.20)<br />
for <strong>the</strong> st<strong>and</strong>ard four-sample phase calculation <strong>of</strong> (3.16).<br />
To <strong>the</strong> left, a simulation result is shown: for each pre-set ∆ϕ , 64 different ϕ O , uniformly distributed over<br />
[0,2π), were inserted into (3.20) to form <strong>the</strong> corresponding sets <strong>of</strong> I n,c , where α=90°. These 64 sets <strong>of</strong> I n,c<br />
were inserted as <strong>the</strong> I n in (3.16) to yield 64 values for ∆ϕ , whose average appears as calculated ∆ϕ . The<br />
average over all ϕ O thus gives <strong>the</strong> expectation value <strong>of</strong> <strong>the</strong> calculated vs. <strong>the</strong> true displacement phase. On<br />
<strong>the</strong> right, <strong>the</strong> measured ∆ϕ ∆ϕ(x), i.e. for vertical sawtooth fringes (cf. Fig. 3.4), averaged over 200<br />
rows <strong>and</strong> represented as grey values, confirms that indeed <strong>the</strong> extraction <strong>of</strong> ∆ϕ is almost impossible after<br />
<strong>the</strong> squaring or rectification process. The white curves refer to <strong>the</strong> difference-<strong>of</strong>-phases method <strong>and</strong> will<br />
be discussed below in 3.2.1.2.








![Skript zur Vorlesung [PDF; 40,0MB ;25.07.2005] - Institut für Physik](https://img.yumpu.com/28425341/1/184x260/skript-zur-vorlesung-pdf-400mb-25072005-institut-fa-1-4-r-physik.jpg?quality=85)
