

Application and Optimisation of the Spatial Phase Shifting ...
Application and Optimisation of the Spatial Phase Shifting ...
Application and Optimisation of the Spatial Phase Shifting ...

You also want an ePaper? Increase the reach of your titles
YUMPU automatically turns print PDFs into web optimized ePapers that Google loves.
172 Improvements on SPS<br />
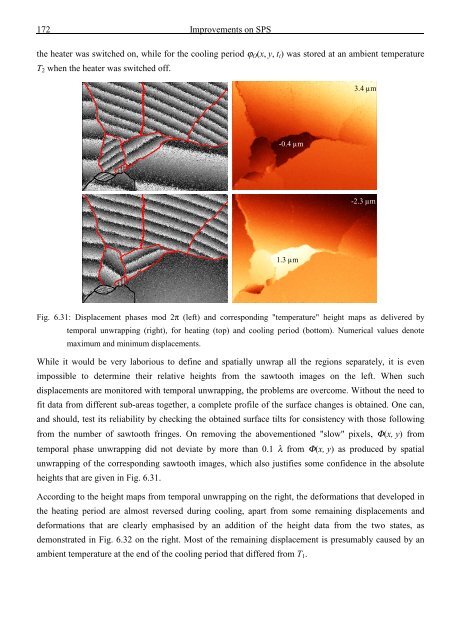
<strong>the</strong> heater was switched on, while for <strong>the</strong> cooling period ϕ O (x, y, t i ) was stored at an ambient temperature<br />
T 2 when <strong>the</strong> heater was switched <strong>of</strong>f.<br />
3.4 µm<br />
-0.4 µm<br />
-2.3 µm<br />
1.3 µm<br />
Fig. 6.31: Displacement phases mod 2π (left) <strong>and</strong> corresponding "temperature" height maps as delivered by<br />
temporal unwrapping (right), for heating (top) <strong>and</strong> cooling period (bottom). Numerical values denote<br />
maximum <strong>and</strong> minimum displacements.<br />
While it would be very laborious to define <strong>and</strong> spatially unwrap all <strong>the</strong> regions separately, it is even<br />
impossible to determine <strong>the</strong>ir relative heights from <strong>the</strong> sawtooth images on <strong>the</strong> left. When such<br />
displacements are monitored with temporal unwrapping, <strong>the</strong> problems are overcome. Without <strong>the</strong> need to<br />
fit data from different sub-areas toge<strong>the</strong>r, a complete pr<strong>of</strong>ile <strong>of</strong> <strong>the</strong> surface changes is obtained. One can,<br />
<strong>and</strong> should, test its reliability by checking <strong>the</strong> obtained surface tilts for consistency with those following<br />
from <strong>the</strong> number <strong>of</strong> sawtooth fringes. On removing <strong>the</strong> abovementioned "slow" pixels, Φ(x, y) from<br />
temporal phase unwrapping did not deviate by more than 0.1 λ from Φ(x, y) as produced by spatial<br />
unwrapping <strong>of</strong> <strong>the</strong> corresponding sawtooth images, which also justifies some confidence in <strong>the</strong> absolute<br />
heights that are given in Fig. 6.31.<br />
According to <strong>the</strong> height maps from temporal unwrapping on <strong>the</strong> right, <strong>the</strong> deformations that developed in<br />
<strong>the</strong> heating period are almost reversed during cooling, apart from some remaining displacements <strong>and</strong><br />
deformations that are clearly emphasised by an addition <strong>of</strong> <strong>the</strong> height data from <strong>the</strong> two states, as<br />
demonstrated in Fig. 6.32 on <strong>the</strong> right. Most <strong>of</strong> <strong>the</strong> remaining displacement is presumably caused by an<br />
ambient temperature at <strong>the</strong> end <strong>of</strong> <strong>the</strong> cooling period that differed from T 1 .


![Skript zur Vorlesung [PDF; 40,0MB ;25.07.2005] - Institut für Physik](https://img.yumpu.com/28425341/1/184x260/skript-zur-vorlesung-pdf-400mb-25072005-institut-fa-1-4-r-physik.jpg?quality=85)


