

Application and Optimisation of the Spatial Phase Shifting ...
Application and Optimisation of the Spatial Phase Shifting ...
Application and Optimisation of the Spatial Phase Shifting ...

Create successful ePaper yourself
Turn your PDF publications into a flip-book with our unique Google optimized e-Paper software.
170 Improvements on SPS<br />
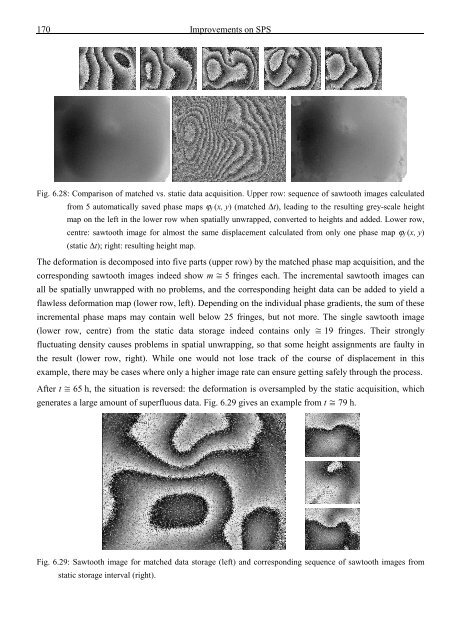
Fig. 6.28: Comparison <strong>of</strong> matched vs. static data acquisition. Upper row: sequence <strong>of</strong> sawtooth images calculated<br />
from 5 automatically saved phase maps ϕ f (x, y) (matched ∆t), leading to <strong>the</strong> resulting grey-scale height<br />
map on <strong>the</strong> left in <strong>the</strong> lower row when spatially unwrapped, converted to heights <strong>and</strong> added. Lower row,<br />
centre: sawtooth image for almost <strong>the</strong> same displacement calculated from only one phase map ϕ f (x, y)<br />
(static ∆t); right: resulting height map.<br />
The deformation is decomposed into five parts (upper row) by <strong>the</strong> matched phase map acquisition, <strong>and</strong> <strong>the</strong><br />
corresponding sawtooth images indeed show m 5 fringes each. The incremental sawtooth images can<br />
all be spatially unwrapped with no problems, <strong>and</strong> <strong>the</strong> corresponding height data can be added to yield a<br />
flawless deformation map (lower row, left). Depending on <strong>the</strong> individual phase gradients, <strong>the</strong> sum <strong>of</strong> <strong>the</strong>se<br />
incremental phase maps may contain well below 25 fringes, but not more. The single sawtooth image<br />
(lower row, centre) from <strong>the</strong> static data storage indeed contains only 19 fringes. Their strongly<br />
fluctuating density causes problems in spatial unwrapping, so that some height assignments are faulty in<br />
<strong>the</strong> result (lower row, right). While one would not lose track <strong>of</strong> <strong>the</strong> course <strong>of</strong> displacement in this<br />
example, <strong>the</strong>re may be cases where only a higher image rate can ensure getting safely through <strong>the</strong> process.<br />
After t 65 h, <strong>the</strong> situation is reversed: <strong>the</strong> deformation is oversampled by <strong>the</strong> static acquisition, which<br />
generates a large amount <strong>of</strong> superfluous data. Fig. 6.29 gives an example from t 79 h.<br />
Fig. 6.29: Sawtooth image for matched data storage (left) <strong>and</strong> corresponding sequence <strong>of</strong> sawtooth images from<br />
static storage interval (right).


![Skript zur Vorlesung [PDF; 40,0MB ;25.07.2005] - Institut für Physik](https://img.yumpu.com/28425341/1/184x260/skript-zur-vorlesung-pdf-400mb-25072005-institut-fa-1-4-r-physik.jpg?quality=85)


